
07.09.2026
Shoaib Mughal
Research by Marketix Digital

Australian online spending reached a record $82.6 billion in 2025. But this headline does not reveal which categories generated the growth or how effectively major retailers serve online shoppers.
Marketix Digital combined national expenditure data, monthly retail figures and mobile performance measurements from 50 Australian-facing eCommerce websites to uncover patterns not presented in the original sources.
Key Findings
Australians spent $82.6 billion online in 2025, an increase of 14%.
Marketix Digital estimates that online expenditure averaged $8,429 per participating household.
The available figures imply approximately 88 online transactions per participating household during 2025.
Online marketplaces and food and liquor generated approximately 41% of the calculated category-level spending increase.
Books, stationery and multimedia recorded the fastest category growth at 24.1%.
Only 16% of the 50 websites analysed by Marketix Digital passed all three mobile Core Web Vitals.
Interaction responsiveness was the most common performance problem, with only 20% of sampled websites achieving a good INP result.
Australian Online Spending Reached $82.6 Billion
Australian eCommerce reached a new high in 2025. Consumers spent $82.6 billion online, representing annual growth of 14% and approximately 24% of total retail expenditure.
Participation also reached record levels. Approximately 9.8 million households made an online purchase during the year, equal to 82% of Australian households. Online shopping was not merely occasional: 41% of participating households purchased online at least once a fortnight.
The average basket value was $96, suggesting that growth was driven by frequent purchasing across millions of households rather than only a small number of high-value orders.
Together, these figures show the scale of Australian eCommerce in 2025:
$82.6 billion in online expenditure
14% annual growth
24% of total retail expenditure
9.8 million participating households
82% household participation
$96 average basket value
41% purchasing online at least fortnightly
Estimated Online Spending Reached $8,429 per Participating Household
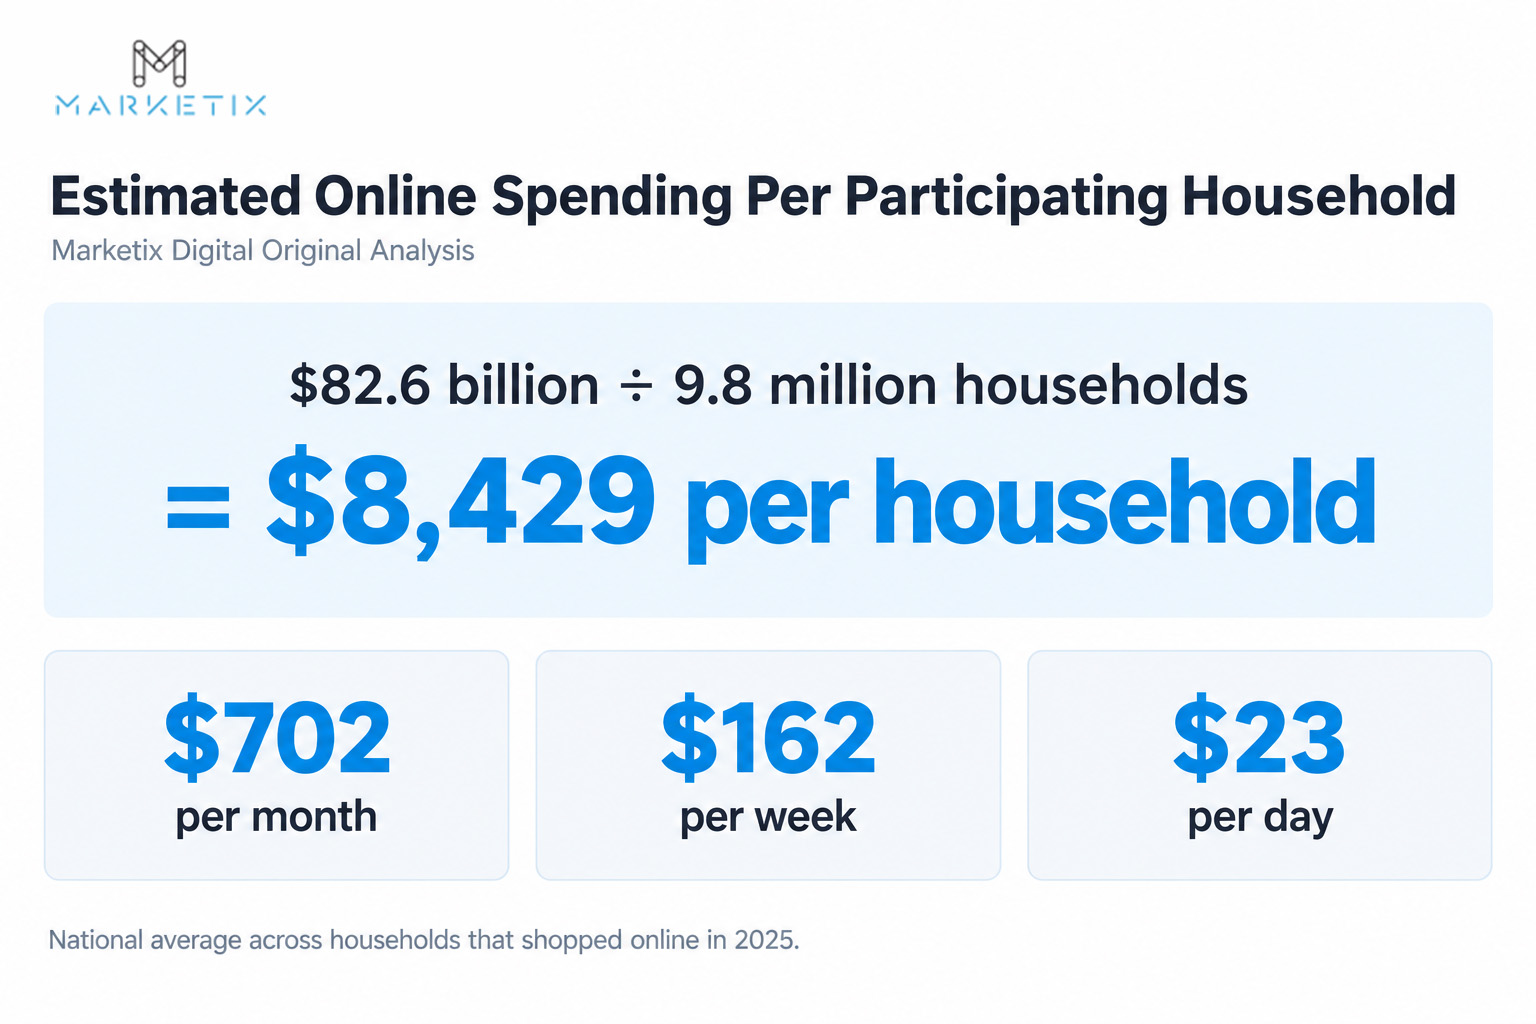
Australia Post reported that Australians spent $82.6 billion online in 2025, with 9.8 million households participating in online shopping.
These figures can be combined to estimate how much online expenditure occurred for each participating household.
Marketix Digital Original Analysis
$82.6 billion ÷ 9.8 million households = $8,429
Marketix Digital estimates that online expenditure averaged approximately $8,429 per participating household in 2025. This is equivalent to approximately:
$702 per month
$162 per week
$23 per day
The calculation provides a clearer indication of the commercial value represented by an online-shopping household. At a national level, each participating household was associated with more than $8,400 in annual online expenditure, equivalent to approximately $162 per week.
At that scale, an online-shopping household represents a recurring pool of expenditure rather than a single annual purchasing event. For retailers, the opportunity is therefore not limited to winning one transaction. It also depends on remaining visible, competitive and easy to buy from as households continue spending throughout the year.
This does not mean every household spent the same amount, or that the expenditure would be captured by the same retailers. It is a national average calculated across all households that made at least one online purchase, with actual spending likely varying considerably by income, age, location and shopping frequency.
Participating Households Made an Estimated 88 Online Purchases
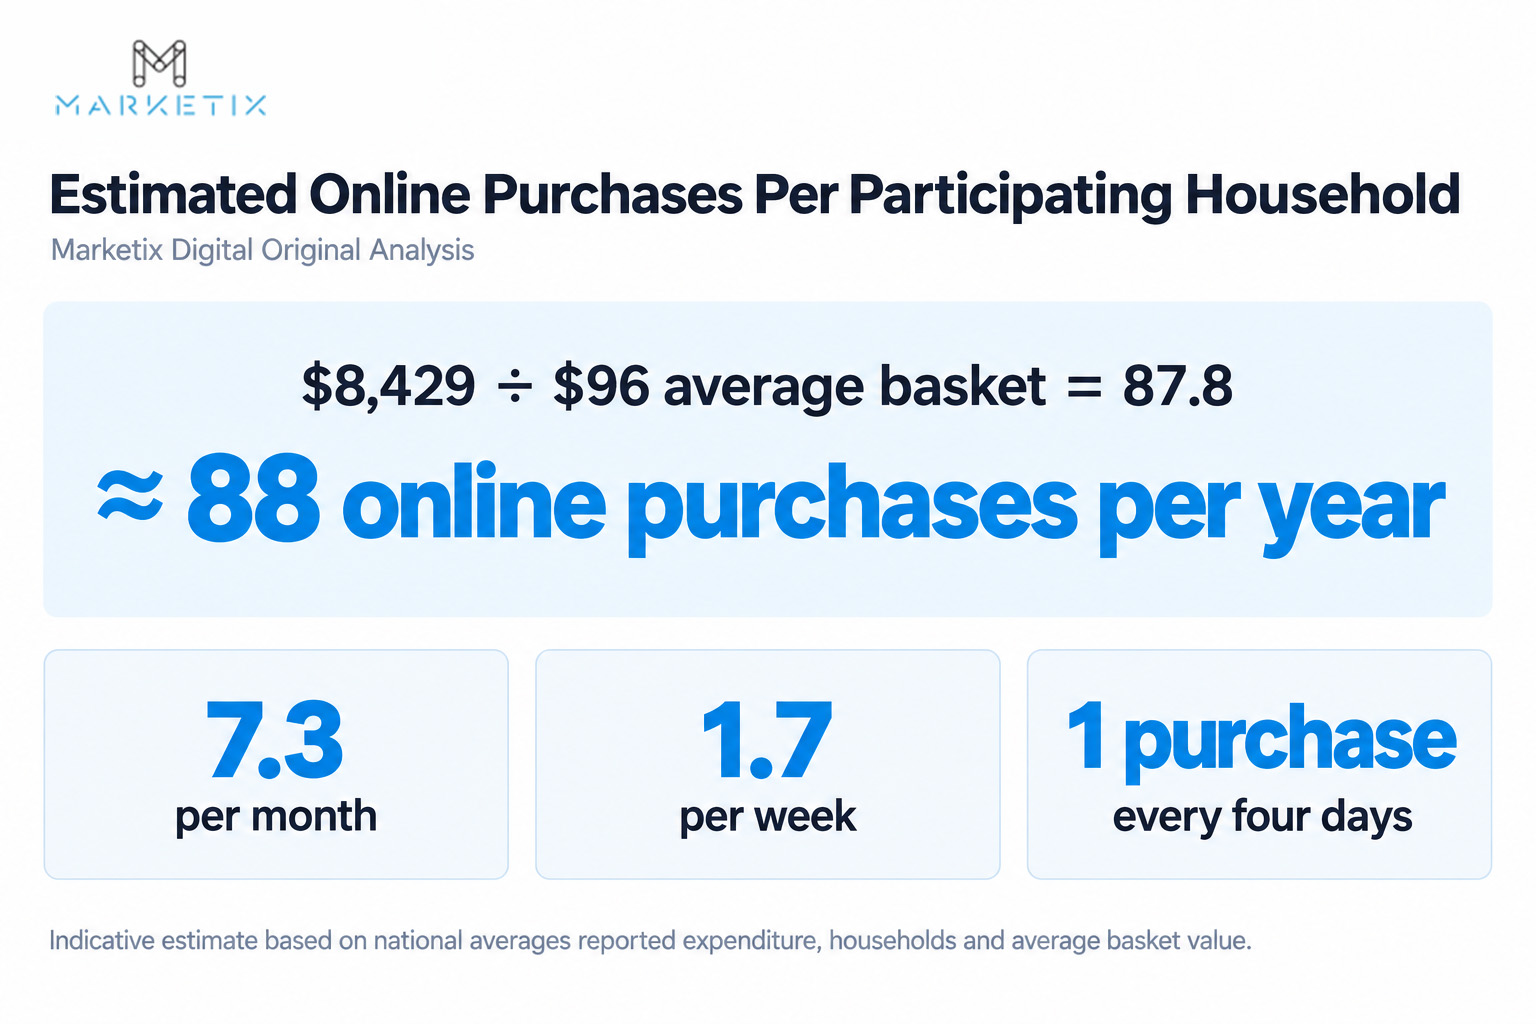
The reported average online basket value was $96 in 2025. Marketix Digital used this figure to estimate how many purchases would produce the calculated average household expenditure of $8,429.
Marketix Digital Original Analysis
$8,429 ÷ $96 = 87.8
This implies approximately:
88 online purchases per year
7.3 purchases per month
1.7 purchases per week
Approximately one purchase every four days
The estimate helps explain how Australia reached $82.6 billion in online expenditure despite an average basket value below $100. The size of the market reflects both widespread household participation and repeated purchasing throughout the year.
Approximately 88 purchases per year is equivalent to one online purchase about every four days. Viewed commercially, this means participating households repeatedly re-enter the online buying journey rather than making only a handful of purchases each year.
Retailers are therefore competing across dozens of potential purchase occasions. Customer acquisition remains important, but so do repeat visibility, retention, usability and the ability to make subsequent purchases easy. A retailer does not need to win every transaction for purchasing frequency to materially increase the lifetime value of an acquired customer.
This is an indicative Marketix Digital estimate, not an official transaction count. It also does not mean an individual retailer could expect 88 orders from one household. The total expenditure, participating-household and average-basket figures may use different underlying datasets or samples, and purchase frequency would vary significantly between occasional and highly active online shoppers.
Where Australians Spent Their Money Online
Australian online expenditure was concentrated in a small number of large retail categories. Online marketplaces led the market with $18.9 billion in expenditure, followed by food and liquor at $16 billion.
Together, these two categories attracted almost $35 billion in online spending during 2025. Fashion and apparel, home and garden, and consumer electronics also exceeded $9 billion each.
Category | 2025 expenditure | Annual growth |
Online marketplaces | $18.9bn | 13.0% |
Food and liquor | $16.0bn | 14.0% |
Fashion and apparel | $11.6bn | 11.5% |
Home and garden | $11.4bn | 10.5% |
Consumer electronics | $9.2bn | 16.0% |
Hobbies and recreational goods | $5.0bn | 17.1% |
Department stores | $4.3bn | 19.5% |
Health and beauty | $3.8bn | 15.1% |
Books, stationery and multimedia | $2.5bn | 24.1% |
The largest categories were not necessarily the fastest-growing. Online marketplaces remained the biggest destination for online expenditure, but their 13% growth rate was below several smaller categories.
Books, stationery and multimedia recorded the fastest percentage growth at 24.1%, followed by department stores at 19.5% and hobbies and recreational goods at 17.1%. However, their smaller starting values meant they added fewer dollars than marketplaces, food and liquor, or consumer electronics.
The category figures total approximately $82.7 billion, slightly above the reported national total of $82.6 billion because Australia Post presents category expenditure in rounded values.
Which Categories Generated the Most New Spending?
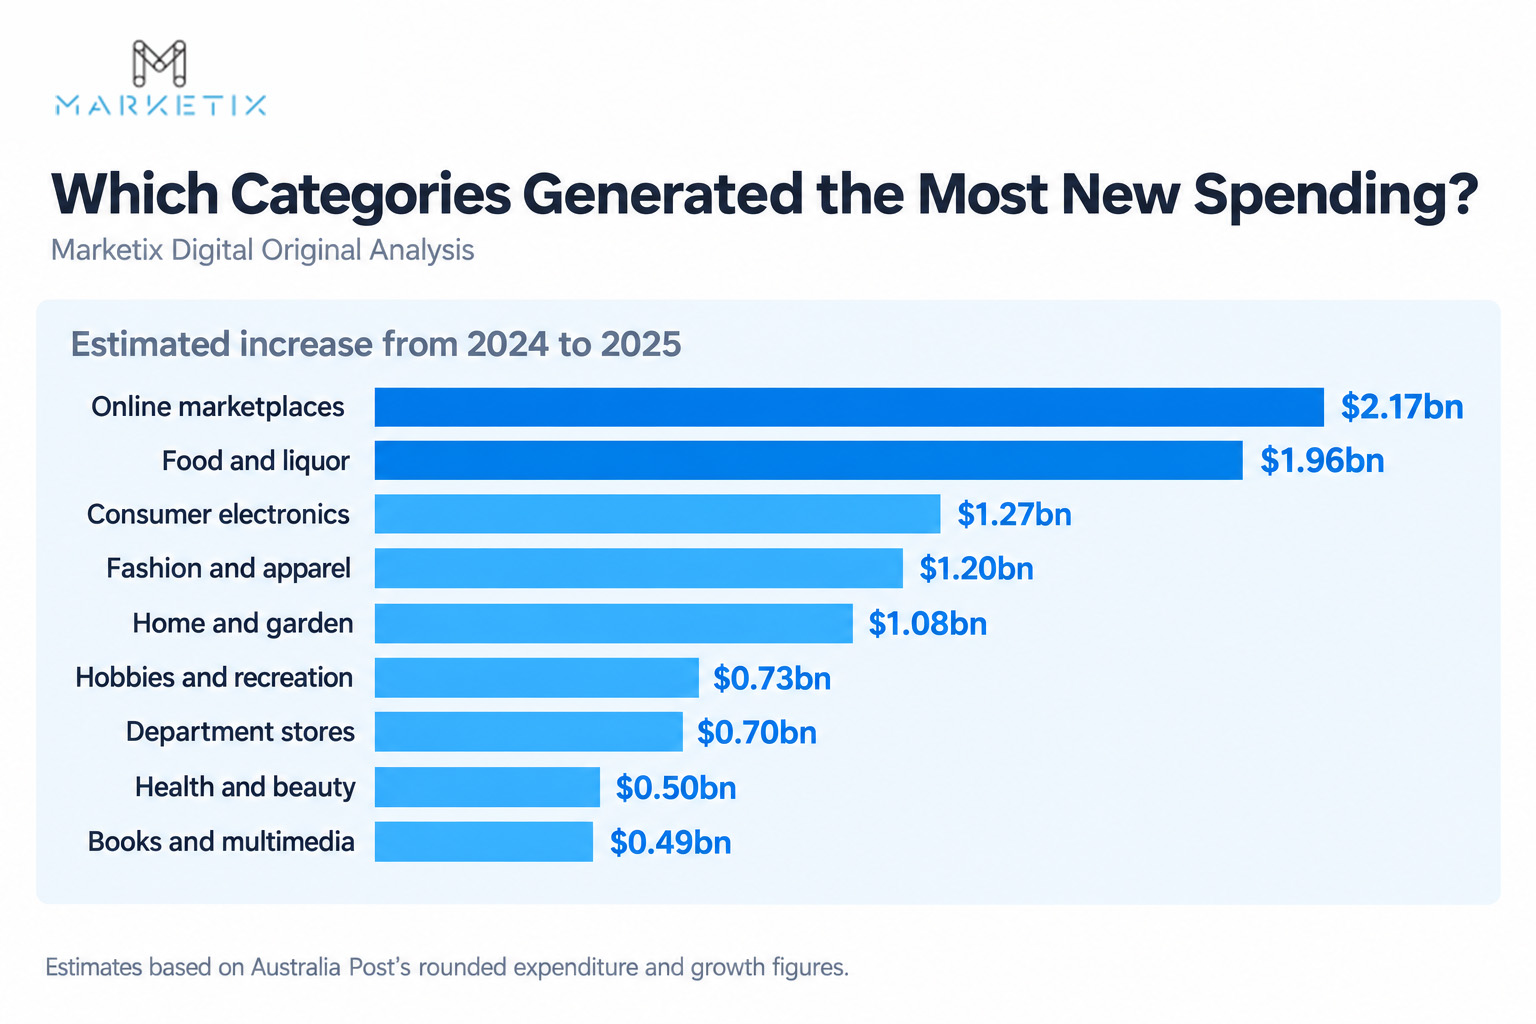
Percentage growth alone does not show how much additional expenditure a category generated. A fast-growing category with a small starting value can add fewer dollars than a larger category growing at a more moderate rate.
Marketix Digital Original Analysis
Australia Post provides each category’s 2025 expenditure and annual growth rate but does not present the previous year’s expenditure in the same table. Marketix Digital reconstructed the estimated 2024 value using:
Estimated 2024 expenditure = 2025 expenditure 1 + annual growth rate
The estimated dollar increase was then calculated as:
Estimated increase = 2025 expenditure − estimated 2024 expenditure
Category | Estimated 2024 expenditure | 2025 expenditure | Estimated increase |
Online marketplaces | $16.73bn | $18.90bn | $2.17bn |
Food and liquor | $14.04bn | $16.00bn | $1.96bn |
Consumer electronics | $7.93bn | $9.20bn | $1.27bn |
Fashion and apparel | $10.40bn | $11.60bn | $1.20bn |
Home and garden | $10.32bn | $11.40bn | $1.08bn |
Hobbies and recreational goods | $4.27bn | $5.00bn | $0.73bn |
Department stores | $3.60bn | $4.30bn | $0.70bn |
Health and beauty | $3.30bn | $3.80bn | $0.50bn |
Books, stationery and multimedia | $2.01bn | $2.50bn | $0.49bn |
Online marketplaces generated the largest estimated dollar increase at $2.17 billion, despite growing by 13%. Food and liquor followed with approximately $1.96 billion in additional expenditure.
By comparison, books, stationery and multimedia recorded the fastest growth rate at 24.1%, but its estimated dollar increase was approximately $486 million because it began from a much smaller base.
This distinction matters commercially. Percentage growth indicates momentum, while the dollar increase shows where the largest amount of new expenditure entered the market. Large established categories can therefore generate more new spending even when smaller categories grow faster.
These are Marketix Digital estimates based on Australia Post’s rounded 2025 expenditure and annual growth figures. They are not published 2024 category totals, and minor differences may result from rounding.
Two Categories Generated 41% of Calculated Growth
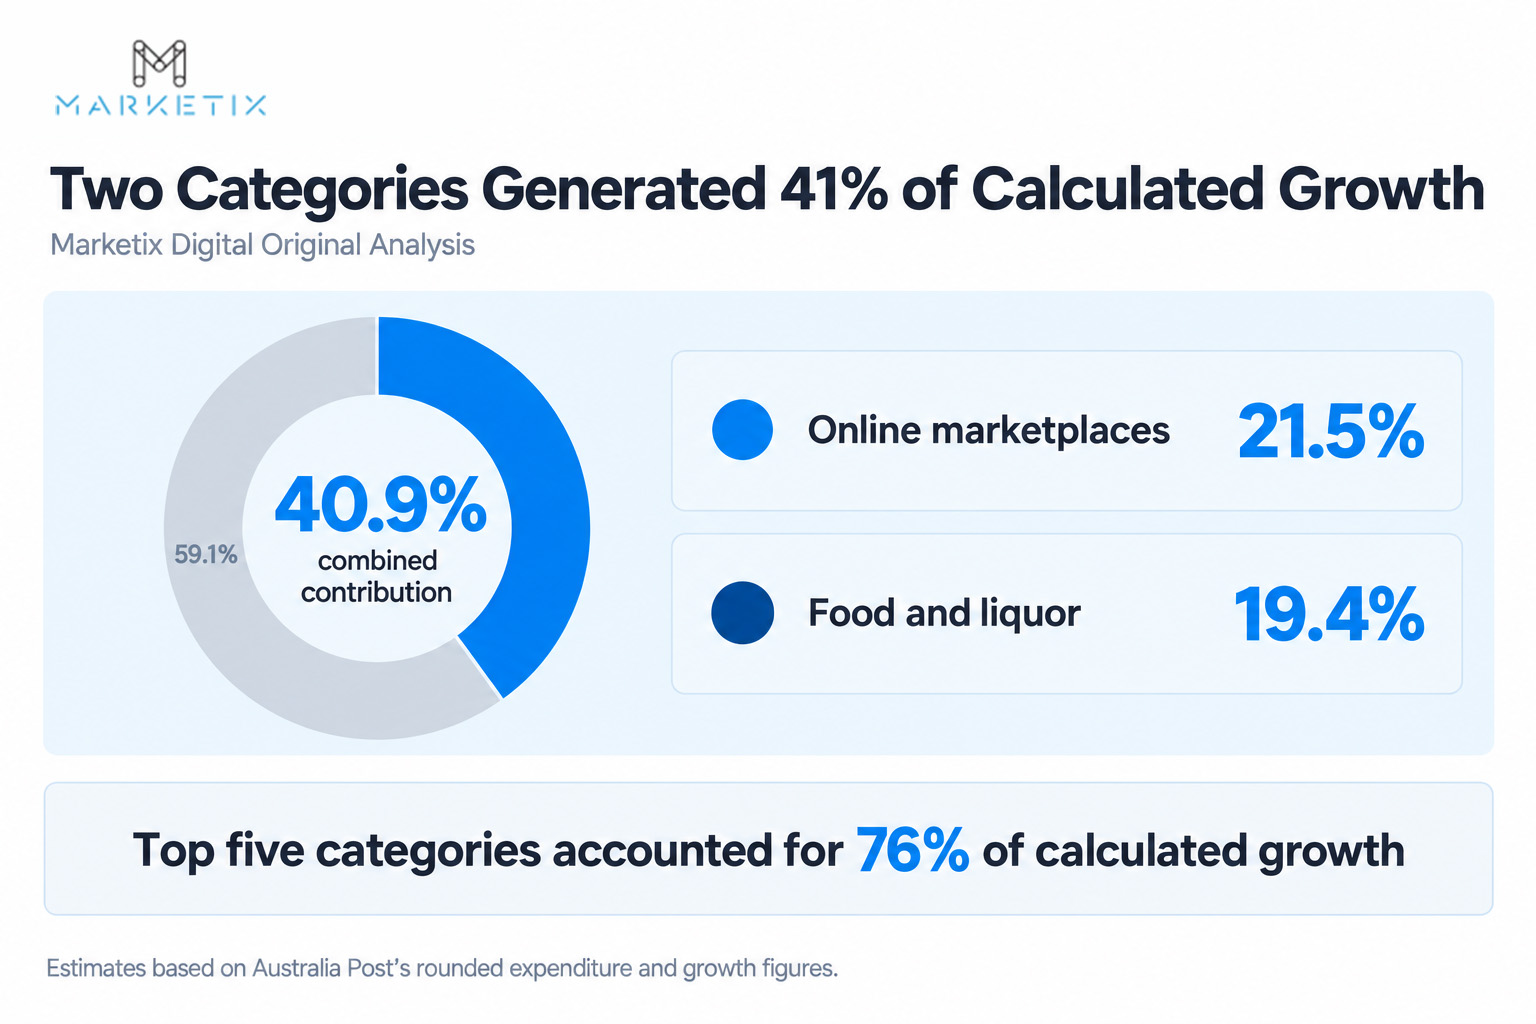
The dollar increases calculated in the previous section can also be used to determine how much each category contributed to the combined increase across the nine measured categories.
Marketix Digital Original Analysis
Marketix Digital divided each category’s estimated spending increase by the combined increase across all nine categories:
Category contribution = Estimated category increase Combined estimated increase × 100
Category | Estimated spending increase | Contribution to calculated growth |
Online marketplaces | $2.17bn | 21.5% |
Food and liquor | $1.96bn | 19.4% |
Consumer electronics | $1.27bn | 12.6% |
Fashion and apparel | $1.20bn | 11.8% |
Home and garden | $1.08bn | 10.7% |
Hobbies and recreational goods | $0.73bn | 7.2% |
Department stores | $0.70bn | 6.9% |
Health and beauty | $0.50bn | 4.9% |
Books, stationery and multimedia | $0.49bn | 4.8% |
Online marketplaces contributed approximately 21.5% of the calculated category-level increase, while food and liquor contributed a further 19.4%. Combined, these two categories generated approximately 40.9%, or roughly 41%, of the estimated increase.
The five largest contributors, online marketplaces, food and liquor, consumer electronics, fashion and apparel, and home and garden, accounted for approximately 76% of calculated growth. Most of the additional expenditure was therefore concentrated in categories that were already substantial.
This concentration matters when interpreting the national eCommerce growth rate. A 14% increase in Australian online expenditure does not mean every retail category experienced the same commercial opportunity. The amount of new spending available to businesses depended heavily on the size and growth characteristics of their individual market.
Fast percentage growth did not always translate into a large contribution. Books, stationery and multimedia grew by 24.1%, but contributed only 4.8% of the calculated increase because its market was considerably smaller.
For retailers assessing market opportunity, the practical decision is therefore to look beyond the national growth headline. Category-level dollar growth provides a better indication of how much additional expenditure entered the market, while percentage growth shows how quickly that market is changing.
These contributions are Marketix Digital estimates based on Australia Post’s rounded category expenditure and growth figures. They describe each category’s share of the combined increase across the nine categories analysed, not an official Australia Post breakdown of national growth.
Fast Growth Did Not Always Mean the Largest Dollar Opportunity
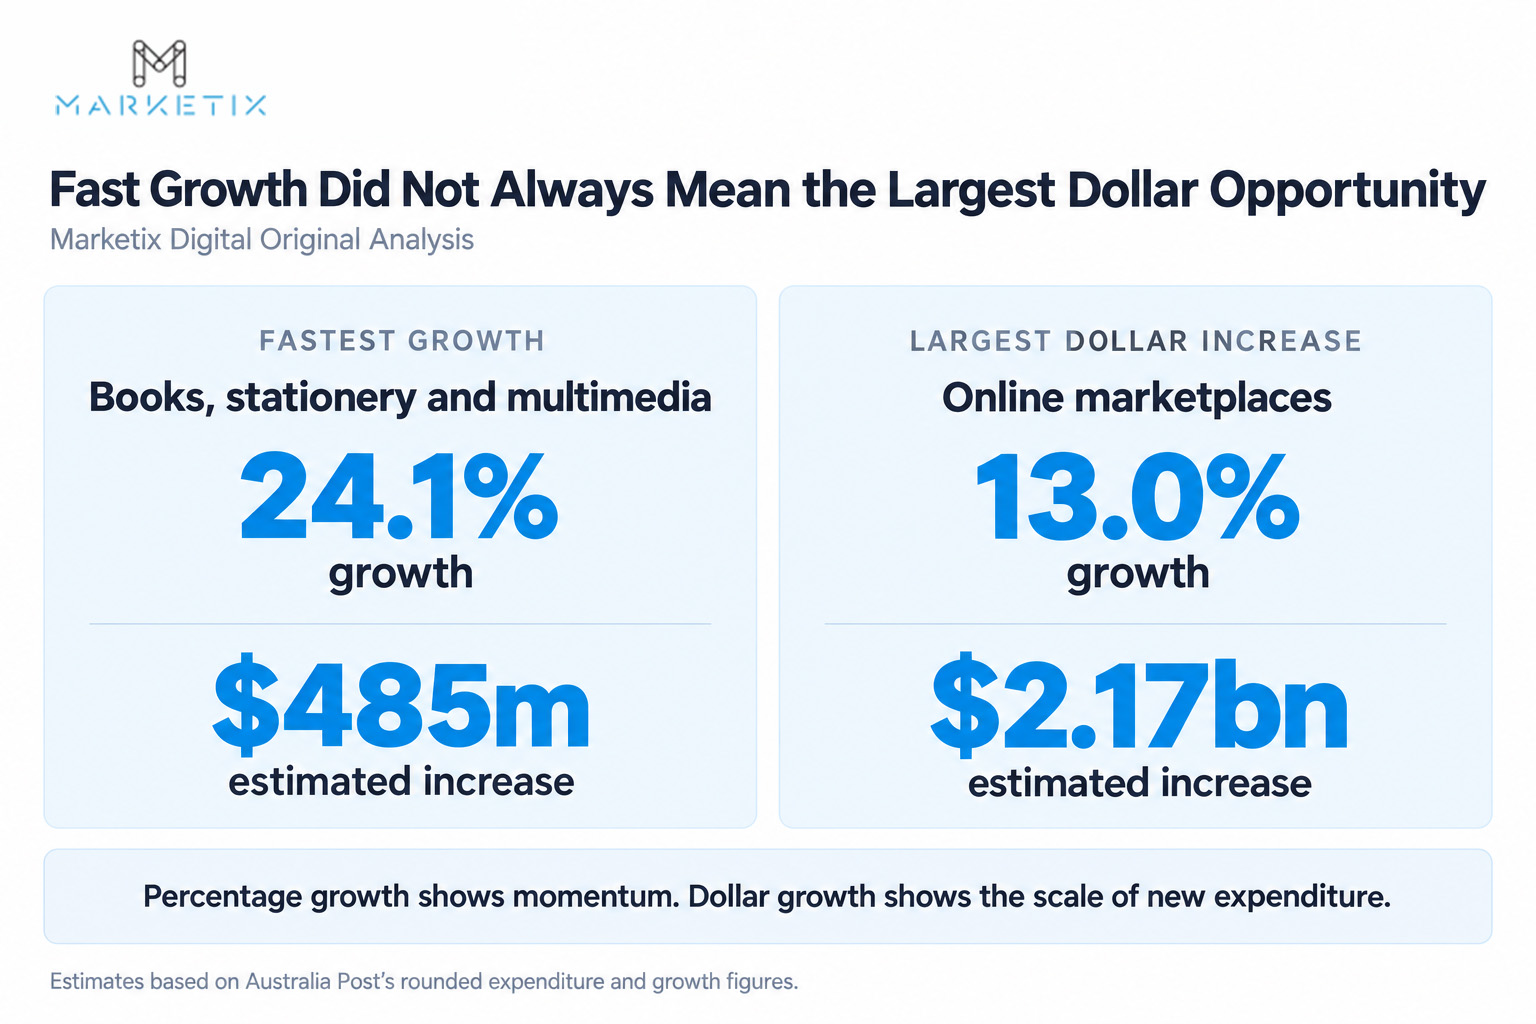
A category’s growth rate measures how quickly it expanded, but it does not show the actual value of new expenditure. The amount added also depends on how large the category was at the beginning of the year.
Marketix Digital Original Analysis
Category | Annual growth | Estimated dollar increase | 2025 expenditure |
Books, stationery and multimedia | 24.1% | $485m | $2.5bn |
Department stores | 19.5% | $702m | $4.3bn |
Consumer electronics | 16.0% | $1.27bn | $9.2bn |
Food and liquor | 14.0% | $1.96bn | $16.0bn |
Online marketplaces | 13.0% | $2.17bn | $18.9bn |
Books, stationery and multimedia recorded the fastest growth at 24.1%, but added approximately $485 million in estimated expenditure. Its high growth rate was applied to a comparatively small starting market.
Online marketplaces produced the opposite result. The category grew by a more moderate 13%, yet added approximately $2.17 billion, more than four times the estimated increase recorded by books, stationery and multimedia.
Food and liquor showed a similar pattern. Its 14% growth translated into approximately $1.96 billion in additional spending. Department stores grew faster at 19.5%, but added approximately $702 million because the category was substantially smaller.
The comparison reveals two different forms of opportunity:
High percentage growth indicates strong momentum.
High dollar growth indicates a larger pool of new expenditure.
For retailers, suppliers and investors, the distinction is important. A fast-growing category may be attractive as an emerging opportunity, while a larger category growing at a slower rate can still generate far more immediate commercial value.
Across the categories analysed, existing market size had a major influence on the amount of new expenditure generated. Growth rates are therefore most meaningful when considered alongside both the category’s starting value and its absolute dollar increase.
These comparisons are based on Marketix Digital’s reconstruction of prior-year expenditure using Australia Post’s rounded 2025 category values and annual growth rates.
Australian Online Retail Continued Growing Through June 2025
The ABS monthly series shows that Australian online retail turnover continued to expand after the sharp changes experienced during the pandemic. Seasonally adjusted online turnover increased from $3.65 billion in June 2022 to $4.70 billion in June 2025.
Month | Seasonally adjusted online turnover | Annual movement | Online share of total retail |
June 2022 | $3.65bn | — | 10.7% |
June 2023 | $3.86bn | 5.9% | 11.0% |
June 2024 | $4.16bn | 7.8% | 11.6% |
June 2025 | $4.70bn | 13.0% | 12.7% |
The annual growth rate accelerated across these June comparisons. Turnover increased approximately 5.9% between June 2022 and June 2023, followed by 7.8% in 2024 and 13% in 2025.
In June 2025 alone, seasonally adjusted online turnover rose 3.9% from the previous month, adding $175.4 million. It was $542.1 million higher than in June 2024.
These comparisons show that online retail was still expanding in the final years covered by the ABS series rather than simply holding on to the elevated levels reached during the pandemic. The acceleration across the June comparisons also indicates that the online channel remained commercially significant as consumer behaviour normalised.
For retailers, that makes online capability an ongoing operating requirement rather than a temporary response to pandemic-era shopping behaviour. Investment decisions around acquisition, website performance, merchandising and fulfilment need to account for a channel that was continuing to increase its share of retail activity.
The June comparisons do not show that every month or retail category followed the same growth pattern, but they provide evidence that Australian online retail remained on an upward trajectory through the final ABS observations.
Non-Food Retail Generated Most Online Turnover
The ABS divides online sales into food and non-food retailing. In June 2025:
Segment | Online turnover | Monthly growth | Share of online turnover |
Food | $1.45bn | 2.5% | 30.8% |
Non-food | $3.25bn | 4.5% | 69.2% |
Total | $4.70bn | 3.9% | 100% |
Non-food retail generated more than twice the online turnover of food retail during the month. It also accounted for approximately 80% of the $175.4 million monthly increase, adding $140.5 million compared with $35 million from food.
Compared with June 2024, food online turnover increased from $1.26 billion to $1.45 billion, while non-food turnover rose from $2.90 billion to $3.25 billion. Both segments therefore contributed to the 13% annual increase.
Online Retail’s Share Continued to Rise
In original terms, online sales represented 12.7% of total retail turnover in June 2025, up from 11.9% in May and 11.6% in June 2024.
The penetration rate differed sharply between retail segments:
Online food sales represented 7.2% of total food retail turnover.
Online non-food sales represented 19% of total non-food retail turnover.
This means that almost one in every five dollars of non-food retail turnover measured by the ABS in June 2025 occurred online.
For non-food retailers, online was therefore no longer a peripheral sales channel. A material share of category expenditure was already being transacted digitally, making the performance of search, product discovery, navigation, product pages and checkout increasingly relevant to the retailer’s overall commercial performance.
The implication is not that every non-food category had exactly the same online penetration rate. Rather, the aggregate figure shows the scale online retail had reached across the segment by the end of the ABS series.
November and December Produced the Largest Seasonal Peaks
The original monthly series shows a clear end-of-year spending pattern:
November recorded the highest original monthly turnover in 2022 and 2023.
December recorded the highest result in 2024.
Original turnover reached $5.28 billion in November 2024 and a record $5.35 billion in December 2024.
These peaks largely disappear from the seasonally adjusted series, confirming that events such as Black Friday, Cyber Monday and Christmas materially affect unadjusted monthly online expenditure.
For retailers, the operational significance is that some of the largest periods of online demand are predictable. Website performance, inventory, merchandising, promotional landing pages, paid media and fulfilment capacity need to be prepared before these demand peaks arrive rather than improved after the sales period has already begun.
Technical weaknesses that are manageable during an ordinary trading month can also become more commercially significant when traffic and purchasing intent rise simultaneously. Peak-season preparation should therefore include both marketing activity and the retailer’s ability to handle the demand that marketing generates.
The June 2025 release was the final edition of the ABS Retail Trade publication. The series therefore supports analysis only through June 2025 and should not be presented as a complete measure of online retail activity for the full year.
Important Methodological Difference
The ABS reported that online retail represented 12.7% of total retail turnover in June 2025, while Australia Post estimated that online purchases represented 24% of retail spending during 2025.
These figures should not be directly compared. The organisations use different data sources, definitions, coverage and reporting periods. They are separate indicators of Australian online retail activity, not conflicting measurements of the same dataset.
Only 16% of Sampled Websites Passed All Core Web Vitals
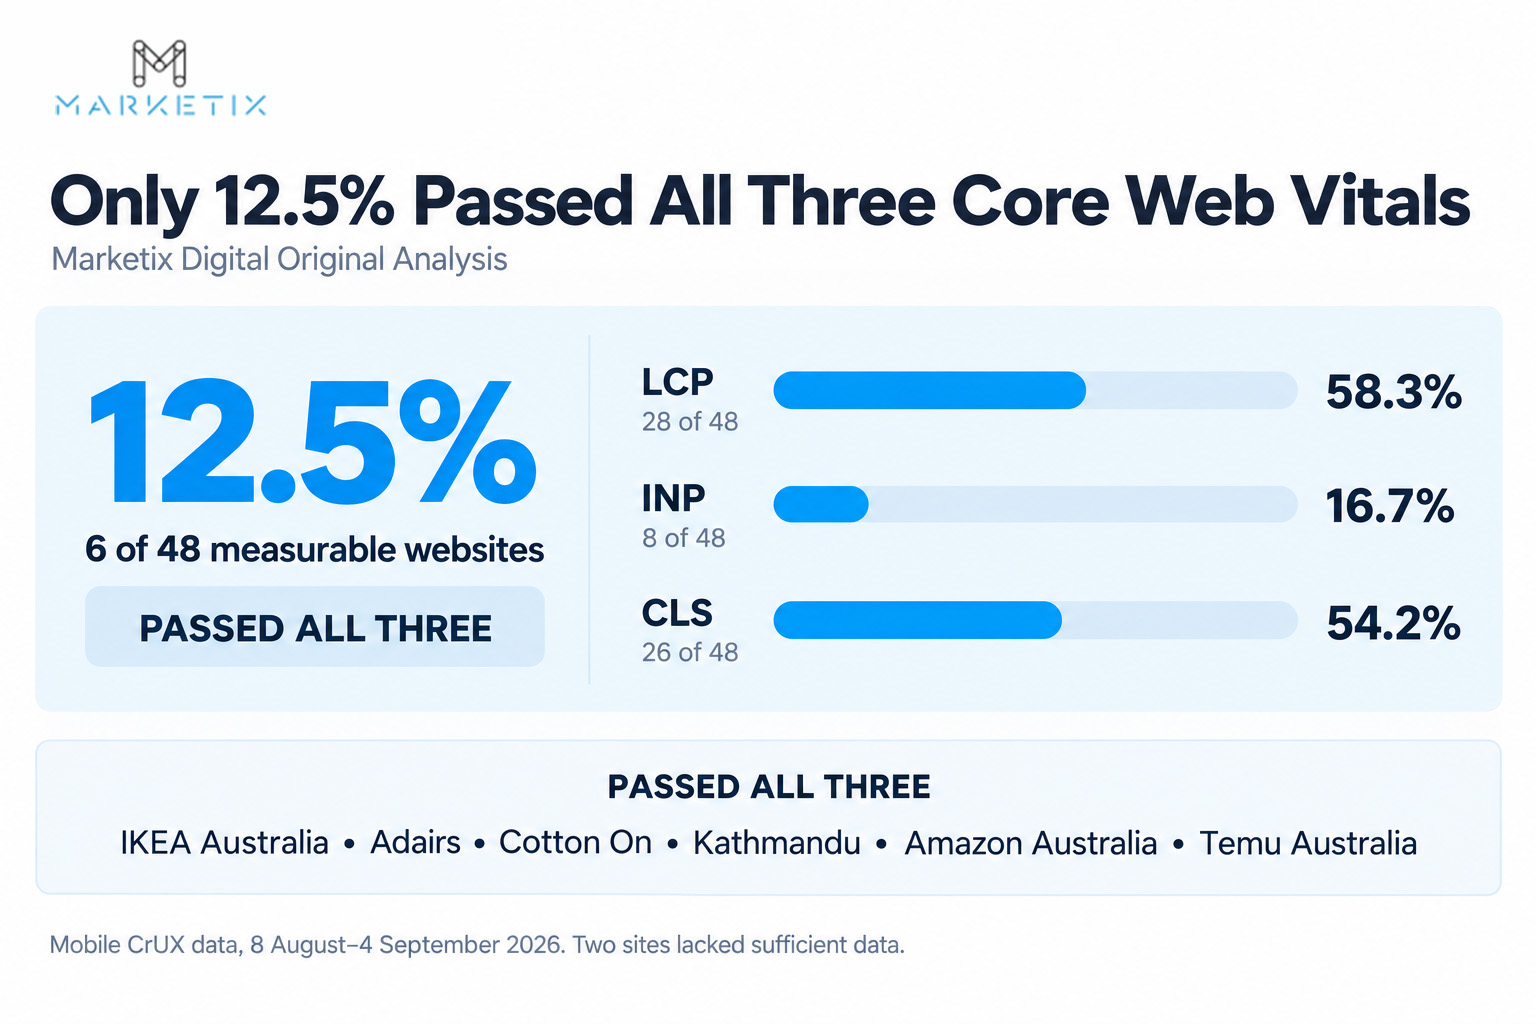
Strong online demand does not automatically mean retailers provide a strong mobile experience. To examine this, Marketix Digital benchmarked prominent Australian-facing eCommerce websites using real-user performance data.
Marketix Digital Original Analysis
Marketix Digital analysed 50 transactional eCommerce websites across 13 retail categories. The sample included department stores, marketplaces, fashion retailers, supermarkets, electronics stores and home and garden businesses.
The analysis used mobile data from the Chrome UX Report, which measures the experiences of real Chrome users. Results represent the 75th percentile over a rolling 28-day period rather than a single laboratory test.
Google’s good thresholds were applied consistently:
LCP: 2,500 milliseconds or less
INP: 200 milliseconds or less
CLS: 0.10 or less
A website was counted as passing all Core Web Vitals only when it achieved a good result for all three measurements.
Metric | Websites rated good | Pass rate |
Largest Contentful Paint | 30 of 50 | 60% |
Interaction to Next Paint | 10 of 50 | 20% |
Cumulative Layout Shift | 28 of 50 | 56% |
All three Core Web Vitals | 8 of 50 | 16% |
Only 8 of the 50 sampled websites passed all three mobile Core Web Vitals simultaneously:
IKEA Australia
Adairs
Cotton On
Country Road
Kathmandu
Amazon Australia
Temu Australia
SHEIN Australia
The remaining 42 websites, or 84% of the sample, failed at least one of the three measurements. Put another way, approximately five in every six websites in the benchmark did not achieve a good result across all three Core Web Vitals simultaneously.
That makes inconsistent mobile performance a common characteristic of the sample rather than an issue confined to a small number of obvious underperformers. A retailer could perform well for loading speed, for example, while still falling outside the recommended threshold for interaction responsiveness or visual stability.
This distinction matters operationally because improving one metric does not necessarily produce a consistently strong mobile experience. Retailers need to examine the complete user journey rather than treating a fast initial page load as evidence that the website is performing well overall.
The benchmark used data covering 8 August to 4 September 2026. Page-level measurements were used where sufficient data was available; otherwise, the documented mobile origin-level result was used as a fallback. Google’s CrUX methodology explains these data-eligibility and aggregation requirements.
These findings apply only to the websites included in the Marketix Digital benchmark. The sample was selected to provide broad category coverage and was not random or weighted by retailer revenue, traffic or market share. It should therefore be treated as a benchmark of the sampled retailers, not every eCommerce website operating in Australia.
Interaction Responsiveness Was the Main Performance Constraint
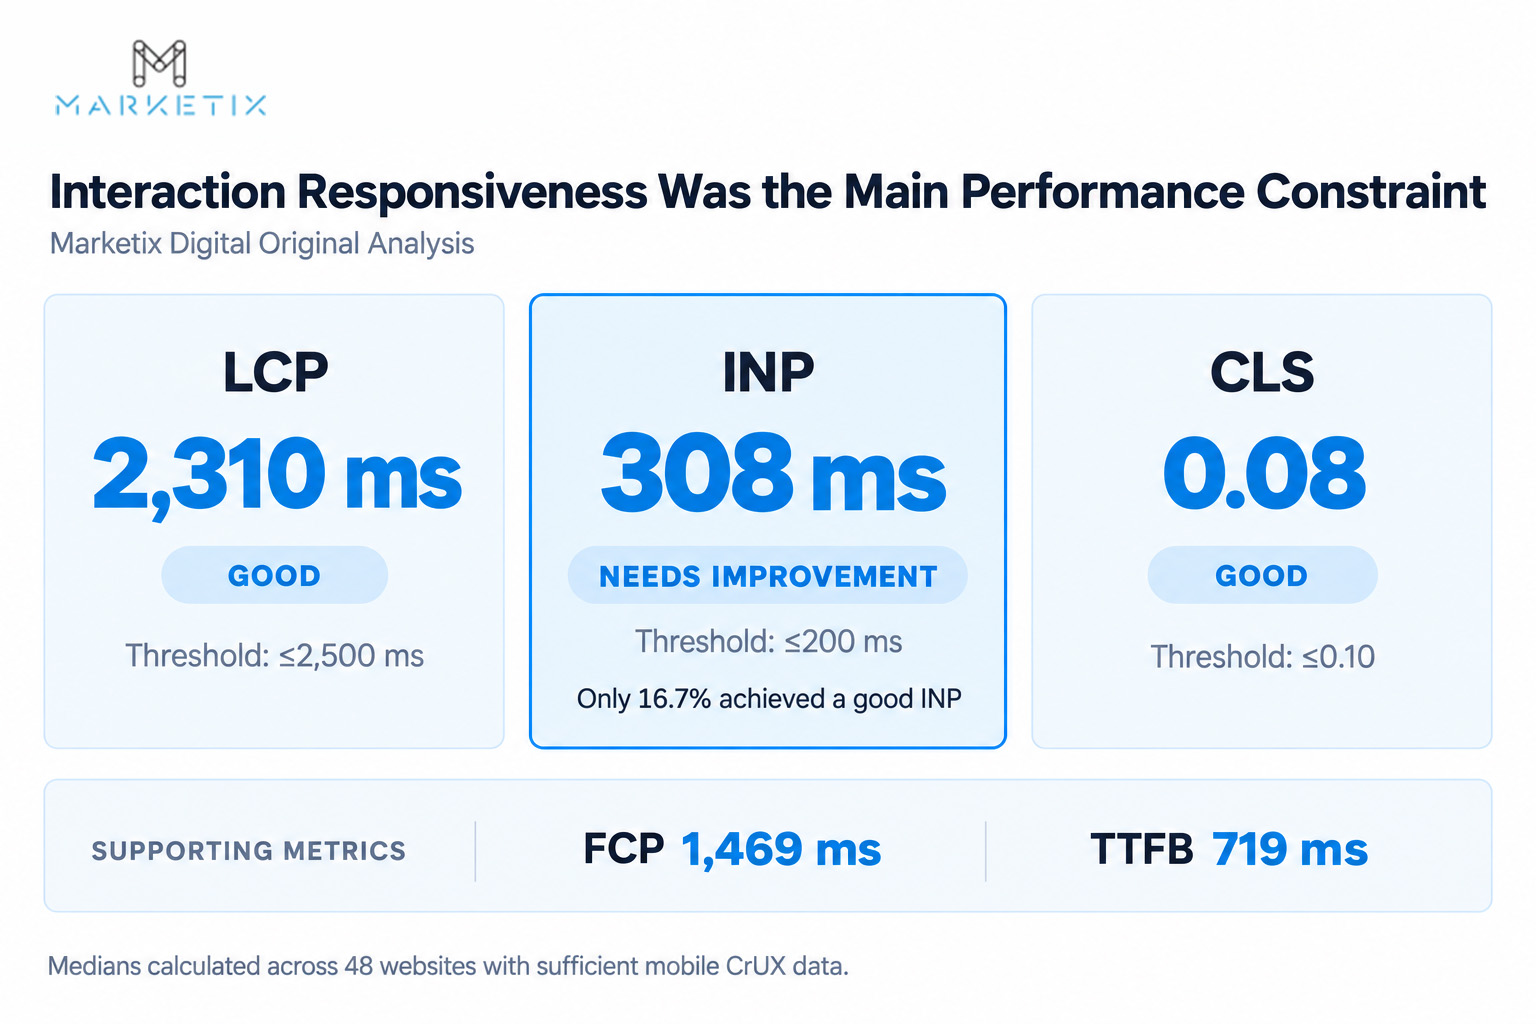
The median results show that loading speed and visual stability were generally stronger than interaction responsiveness across the 50-site sample.
Marketix Digital Original Analysis
Metric | Sample median | Assessment |
Largest Contentful Paint | 2,310 ms | Good |
Interaction to Next Paint | 308 ms | Needs improvement |
Cumulative Layout Shift | 0.08 | Good |
First Contentful Paint | 1,469 ms | Supporting metric |
Time to First Byte | 719 ms | Supporting metric |
The median Largest Contentful Paint was 2,310 milliseconds, placing it inside Google’s good threshold of 2,500 milliseconds. This indicates that the main content generally became visible within the recommended timeframe.
The median Cumulative Layout Shift was 0.08, also within Google’s good threshold of 0.10. At the sample level, visual stability was therefore less problematic than interaction responsiveness.
However, the median Interaction to Next Paint was 308 milliseconds. Google classifies INP of 200 milliseconds or less as good, between 200 and 500 milliseconds as needing improvement, and above 500 milliseconds as poor.
INP measures how quickly a page provides visual feedback after a user interacts with it. On an eCommerce website, relevant interactions can include:
Opening navigation menus
Selecting product filters
Changing product variations
Adding an item to the cart
Opening delivery or payment options
Using interactive search features
Only 10 of the 50 websites analysed, or 20%, achieved a good mobile INP result. Put another way, four in five websites in the sample did not reach Google’s good interaction-responsiveness threshold.
By comparison, 60% achieved a good LCP result and 56% achieved a good CLS result. The gap suggests that initial loading speed and visual stability were considerably more likely to meet Google's recommended thresholds than the website's ability to respond quickly after a shopper attempted to interact with it.
That distinction matters on an eCommerce website. A page can appear to have loaded successfully while still responding more slowly when a shopper opens a menu, applies a filter, selects a variation, searches for a product or attempts to add an item to the cart.
For technical and eCommerce teams, this changes where investigation may need to occur. Optimisation should not stop once pages load quickly. Retailers should also test what happens after the page becomes visible and the customer begins using it.
FCP and TTFB were included as supporting diagnostic measurements. They can help explain how quickly the browser receives and begins displaying content, but they are not part of the three current Core Web Vitals used for the overall assessment.
These results identify a technical pattern, not a measured commercial outcome. Without retailer-level traffic, transaction and conversion data, the analysis cannot determine how much revenue, if any, was affected by slower interaction responsiveness.
High Online Demand Did Not Guarantee Strong Mobile Performance
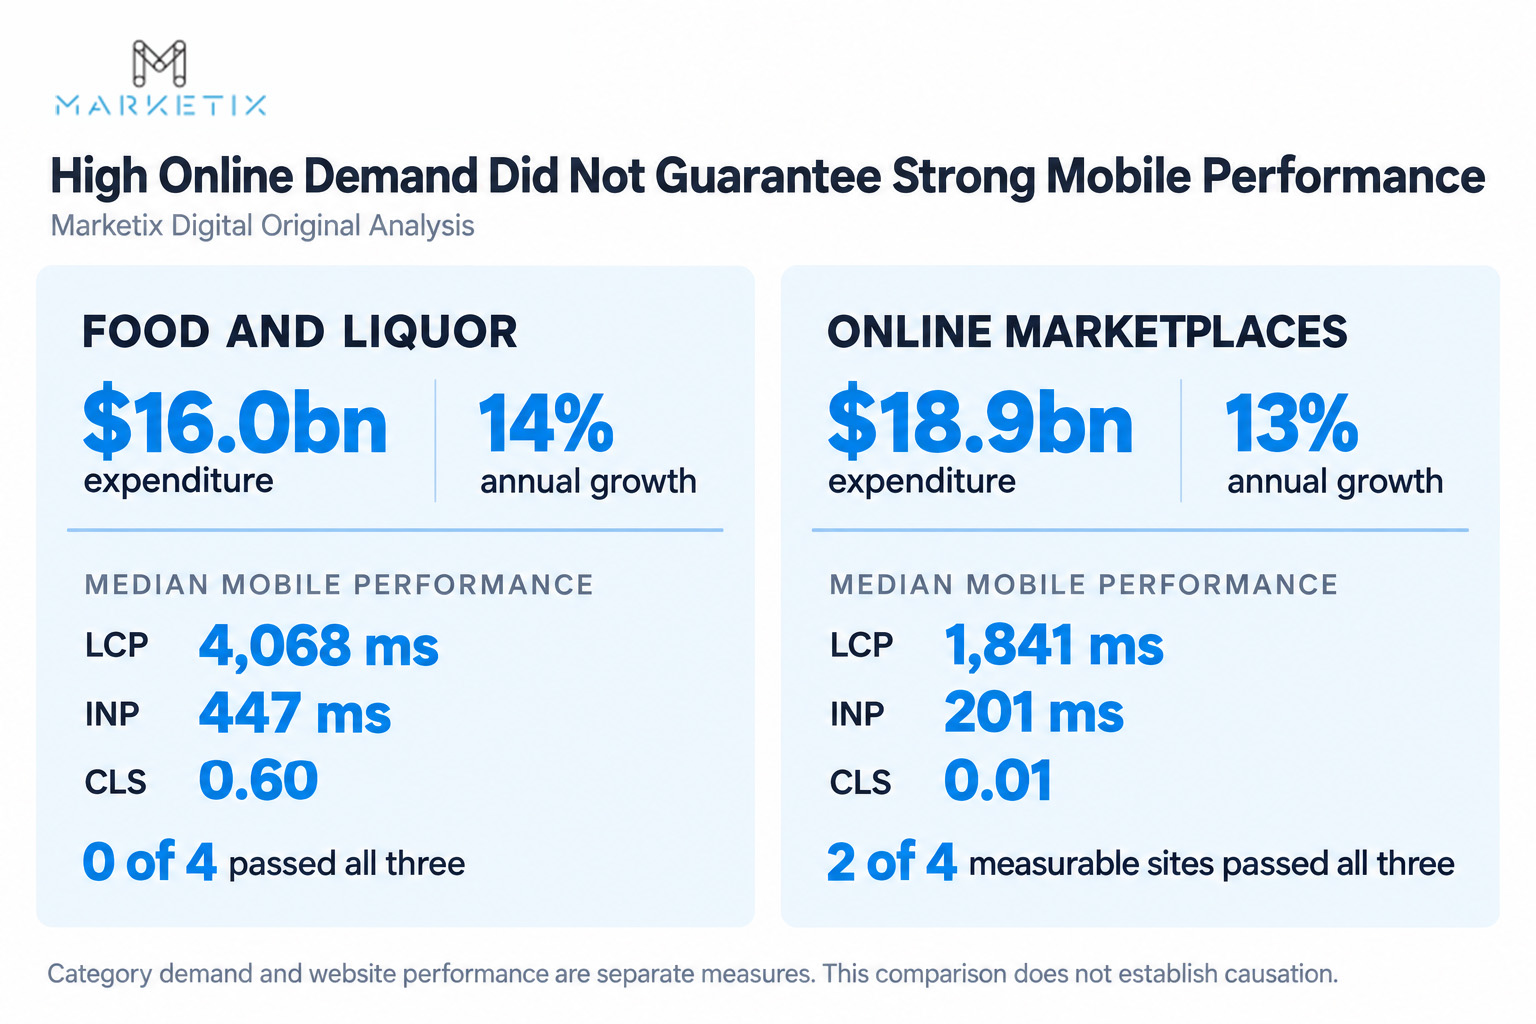
Marketix Digital compared category-level expenditure with the mobile performance of retailers operating in those markets. The clearest contrast appeared between food and liquor businesses and marketplace-focused websites.
Marketix Digital Original Analysis
Category | 2025 expenditure | Annual growth | Median LCP | Median INP | Median CLS | Passing all three |
Food and liquor | $16.0bn | 14% | 4,068 ms | 447 ms | 0.60 | 0 of 4 |
Online marketplaces | $18.9bn | 13% | 1,841 ms | 201 ms | 0.01 | 2 of 4 measurable sites |
Australia Post reported $16 billion in food and liquor online expenditure, following annual growth of 14%. However, none of the four food and liquor websites analysed by Marketix Digital passed all three mobile Core Web Vitals.
The category recorded:
Median LCP of 4,068 milliseconds
Median INP of 447 milliseconds
Median CLS of 0.60
Zero of four websites passing all three metrics
The median LCP and INP results were classified as needing improvement, while the median CLS result was well above Google’s poor threshold of 0.25. Food and liquor therefore recorded the weakest combined median performance among the major categories in the Marketix sample.
Marketplace and variety websites produced a different result. Australia Post reported $18.9 billion in expenditure through pure online marketplaces, with annual growth of 13%.
Among the four marketplace and variety websites with complete mobile data:
Median LCP was 1,841 milliseconds
Median INP was 201 milliseconds
Median CLS was 0.01
Two of four websites passed all three metrics
This category achieved the highest overall pass rate in the sample. Its median LCP and CLS were comfortably within Google’s good thresholds, while median INP missed the good threshold by only one millisecond.
The comparison suggests that substantial consumer demand can exist alongside very different levels of mobile technical performance. Food and liquor combined $16 billion in expenditure and 14% annual growth with weak sampled Core Web Vitals, while marketplace and variety websites combined higher expenditure with considerably stronger median performance.
The practical implication is that strong market demand should not be interpreted as evidence that a retailer's digital experience is already performing well. A category can continue growing despite technical weaknesses because expenditure is also influenced by factors including consumer demand, product necessity, pricing, brand strength and competitive conditions.
Retailers therefore need to assess market opportunity and digital execution separately. Category expenditure shows the size of the commercial opportunity, while field performance data helps identify whether the website is technically well positioned to serve that demand.
However, this comparison does not prove that website performance caused either category’s expenditure or growth. The Australia Post figures measure category-level demand, while the Marketix analysis covers a small, non-random selection of individual websites. The marketplace and variety sample is also an indicative proxy and does not exactly match Australia Post’s definition of pure online marketplaces.
What the Findings Mean for Australian Retailers
Australian eCommerce is large, frequent and increasingly concentrated in a number of substantial categories.
Participating households were associated with an estimated $8,429 in annual online expenditure and approximately 88 purchases during 2025. At the same time, online marketplaces and food and liquor generated approximately 41% of the calculated category-level spending increase, while the five largest contributors accounted for approximately 76%.
The commercial opportunity is therefore not distributed evenly. Retailers need to understand both how quickly their category is growing, how many additional dollars are entering that market, and broader Australian eCommerce traffic statistics showing how shoppers find and interact with online retailers.
The website benchmark introduces a second part of the decision. Strong demand alone does not guarantee strong digital execution. Only 16% of the sampled websites passed all three mobile Core Web Vitals, while only 20% achieved a good INP result.
For retailers, the practical priorities are:
- Measure the market in dollars as well as percentages. A rapidly growing small category can still generate less new expenditure than a larger category growing more slowly.
- Treat repeat purchasing as part of the opportunity. Participating households made an estimated 88 online purchases during the year, meaning retailers compete across recurring buying occasions rather than a single transaction.
- Assess demand and website execution separately. Strong category sales or revenue growth should not automatically be treated as evidence that the digital experience is performing well.
- Investigate interaction responsiveness, not only page loading. Four in five websites in the benchmark did not achieve a good INP result, making post-load interaction a particularly common area for investigation.
- Prepare before seasonal demand arrives. Black Friday, Cyber Monday and Christmas created the largest unadjusted monthly peaks in the ABS series, making pre-peak technical, merchandising and fulfilment preparation important.
- Use real-user performance data continuously. Website performance can change as templates, applications, third-party scripts and customer behaviour change.
The strongest commercial opportunity is likely to exist where meaningful category demand, repeated customer purchasing and room for better digital execution overlap.
The role of the retailer is therefore not simply to participate in a growing eCommerce market. It is to identify where demand is actually increasing, understand how frequently customers are buying, and ensure the digital experience is capable of serving that demand when shoppers arrive.
Methodology
This report combines Australia Post expenditure data, ABS online retail figures and Marketix Digital’s analysis of Australian-facing eCommerce websites.
Data Sources
Australia Post eCommerce Report 2026: National expenditure, household participation, basket value, category expenditure and annual growth.
ABS Retail Trade: Monthly online turnover, food and non-food sales, and online retail’s share of total retail from January 2022 to June 2025.
Google Chrome UX Report: Mobile LCP, INP, CLS, FCP and TTFB measurements.
The ABS Retail Trade publication ceased after June 2025. No ABS online-turnover claims were made beyond that date.
Marketix Digital Calculations
Marketix Digital calculated:
Household expenditure = Total online expenditure Participating households
Estimated purchases = Household expenditure Average basket value
Estimated 2024 category value = 2025 expenditure 1 + annual growth
Category contribution = Estimated category increase Combined increase across all categories × 100
All reconstructed category values are estimates based on Australia Post’s rounded figures.
Website Sample
Marketix Digital collected mobile CrUX data on 6 September 2026, covering 8 August to 4 September 2026.
The 50 websites included:
Department stores: Kmart, Myer, Big W, Target and David Jones
Home and garden: Bunnings, IKEA, Temple & Webster, Adairs, Freedom, Spotlight, Fantastic Furniture and Amart
Electronics: JB Hi-Fi, Officeworks, The Good Guys, Harvey Norman and Appliances Online
Food and liquor: Woolworths, Coles, Dan Murphy’s and BWS
Health and beauty: Chemist Warehouse, Mecca, Adore Beauty, Sephora and Priceline
Fashion: The Iconic, Cotton On, Country Road, Princess Polly, Culture Kings, City Beach and Lorna Jane
Other categories: Rebel, Anaconda, Kathmandu, Supercheap Auto, Petbarn, Pet Circle, Booktopia, Dymocks, Kogan, Amazon Australia, eBay Australia, Temu, SHEIN, Baby Bunting, Michael Hill and Prouds
Page-level mobile data was used where available, with origin-level data used as a fallback. Country Road and SHEIN lacked sufficient mobile data and were excluded from performance calculations, leaving 48 measurable websites.
Google’s good thresholds were:
LCP: 2,500 ms or less
INP: 200 ms or less
CLS: 0.10 or less
A website passed only when all three measurements were good.
Limitations
The website analysis covers a fixed sample of 50 Australian-facing transactional websites. It is not random, market-weighted or representative of every Australian eCommerce website.
Category sample sizes varied, performance can change over time, and category expenditure cannot be attributed to individual retailers. The analysis does not claim that website performance caused differences in spending or growth.
Data Sources
This report combines national eCommerce data, monthly retail figures and real-user mobile performance measurements. The complete sources are:
Australia Post eCommerce Report 2026: National online expenditure, household participation, average basket value, category expenditure and annual growth.
Australia Post Online Marketplaces Report 2026: Marketplace expenditure, growth and category-specific findings.
Australian Bureau of Statistics – Retail Trade, Australia: Monthly online turnover, food and non-food sales, and online retail’s share of total retail through June 2025.
Google Chrome UX Report: Real-user website-performance data used for the retailer analysis.
Chrome UX Report Methodology: Collection periods, eligibility requirements and 75th-percentile reporting methodology.
Google Interaction to Next Paint: Definition and thresholds used to assess website responsiveness.
Google Web Vitals: Definitions and thresholds for LCP, INP and CLS.
About Marketix Digital
Marketix Digital is a Sydney-based SEO agency helping Australian eCommerce businesses increase organic visibility, qualified traffic and revenue.
Led by Shoaib Mughal, the team combines more than 20 years of SEO experience with technical analysis, content strategy and commercial insight. Marketix focuses on sustainable growth and measurable business outcomes rather than rankings alone.
Recent Posts



Recent Posts