Marketix analysis shows why higher-value AI search visits may still leave businesses with a revenue shortfall when organic traffic falls.
Visitors arriving through AI search can become valuable customers. The question is whether enough of them arrive to replace the revenue from lost organic visits.
Adobe's US retail analysis found that AI-referred visits generated 83% more revenue per visit than non-AI traffic in September 2026. Conversion rates were 90% higher. These visitors were more valuable on average, but that alone does not show how much additional revenue AI search can deliver. [1]
The stakes are substantial. Australian search advertising revenue reached A$8.6 billion in FY26, up 13.2%, according to IAB Australia and PwC. That spending shows how much businesses invest in reaching customers through search. [2]
Marketix has reviewed the published evidence and built an editable revenue-replacement model. Our conclusion is that businesses need to measure the value of displaced visits, the volume of additional AI referrals and the commercial effect across the whole buying journey. A better conversion rate alone cannot settle the investment decision.
Across the 118,671 websites in Ahrefs' Web Analytics dataset, AI assistants accounted for 0.46% of visits in October 2026. Google accounted for 24.74%. In that dataset, Google still supplied far more traffic. [3]
AI can also influence purchases without sending the final visit. Similarweb reported that consumers using AI for shopping research also used search 89% of the time. Buyers are moving between the two as they research and compare options. [4]
A buyer might discover a supplier through an AI answer, search for the brand later and submit an enquiry through Google. Another buyer might arrive through an AI link after already deciding what to purchase. Last-click attribution can credit different channels for these journeys without revealing which touchpoint changed the decision.
Track direct AI referrals alongside evidence that AI helped customers discover the business. Keep those measures separate so the same sale is not counted twice.
Ahrefs' February 2026 study found that position-one click-through rates were 58% below the level its model estimated without AI Overviews. The analysis covered 300,000 desktop keywords. This helps explain how a business can keep its ranking while receiving fewer clicks. [5]
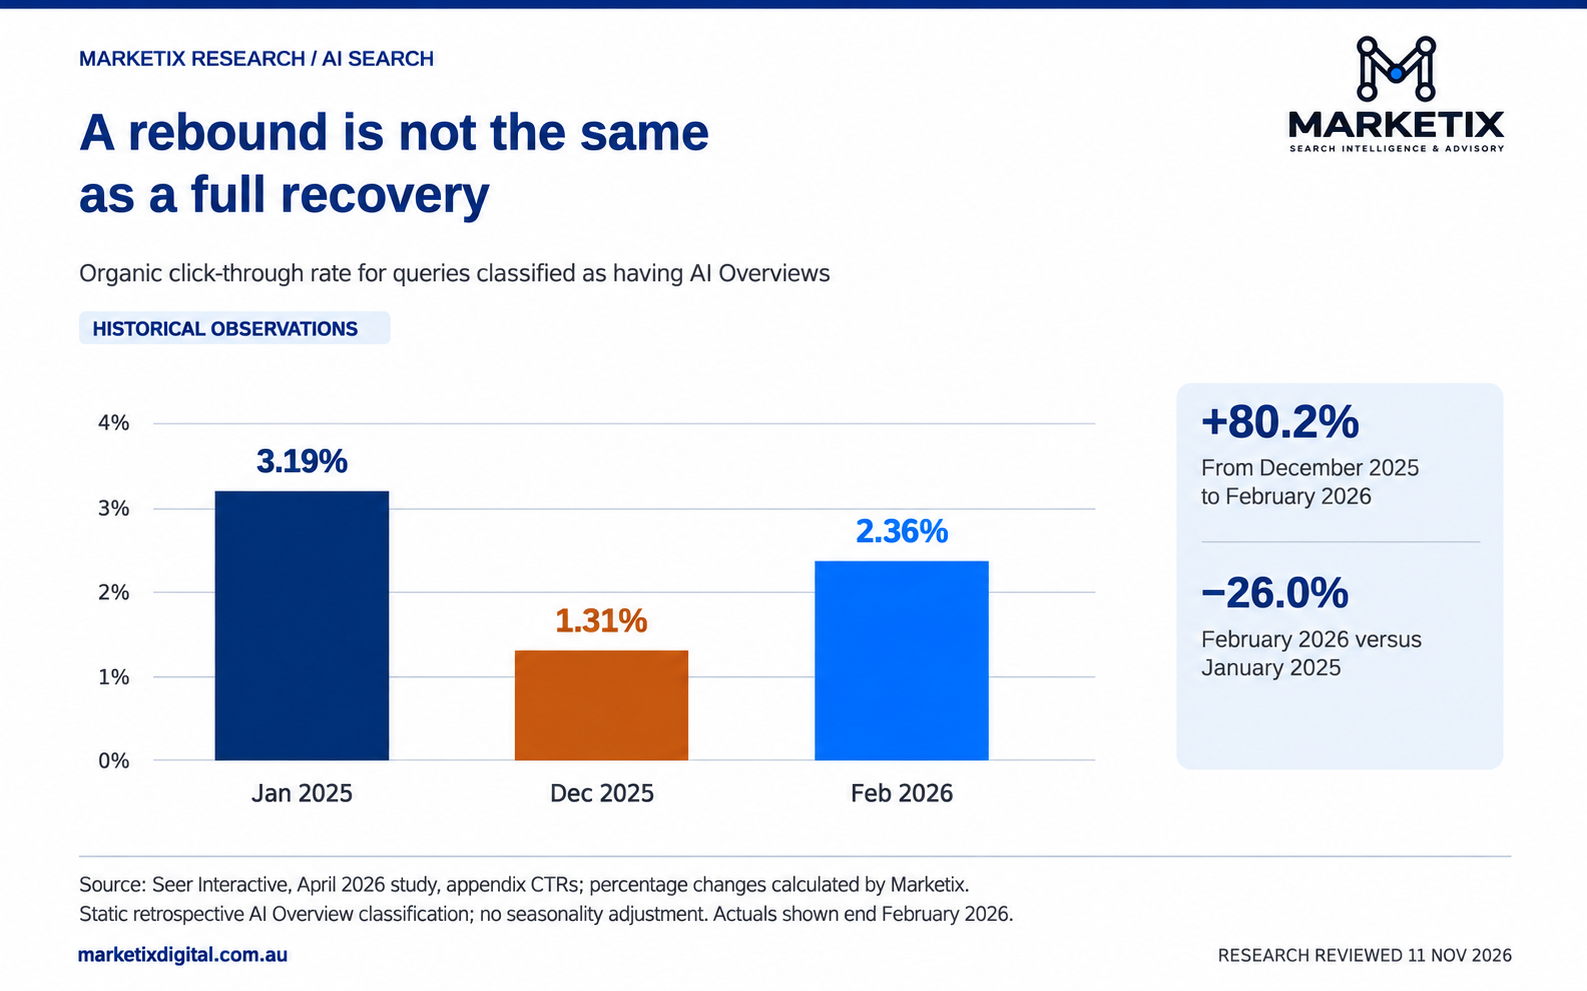
Seer's April study showed a partial recovery. Organic click-through rates for searches with AI Overviews fell from 3.19% in January 2025 to 1.31% in December, then recovered to 2.36% in February 2026. That was an 80.2% rebound from December, but still 26.0% below the starting point. [6]
Figure 1. Seer appendix observations through February 2026. Marketix calculations show an 80.2% rebound from December and a 26.0% shortfall against January 2025. [6]
Pew's US browsing study found a similar pattern. Users clicked a traditional search result on 8% of visits where an AI summary appeared, compared with 15% where it did not. [7]
After AI Overviews launched in France in July 2026, Ahrefs found a median click-through-rate decline of 23.1% among highly exposed websites, compared with 5.7% across all 963 websites studied. [8]
An August preprint by Wang and colleagues adds experimental evidence. In a US browser experiment, removing AI Overviews increased outbound click-through rates by an estimated 8.8 percentage points. [9]
Google, meanwhile, said in August 2025 that total organic clicks were relatively stable year on year. A stable overall total can still hide losses for individual businesses and types of search. [10]
Together, these findings show why rankings alone are no longer enough to judge performance. Businesses need to know which searches still bring visitors, what those visitors are worth and whether other sources are making up the difference. The impact will vary by business.
Start with the visits that disappear and the revenue they would otherwise have generated. Do not automatically value an early research visit at the same level as a branded product enquiry.
The basic calculation is:
Additional AI visits required = displaced revenue / revenue per additional AI visit.
Using the 1.83 revenue-per-visit ratio from the Adobe study, a hypothetical business would need approximately 55 additional AI visits to replace the revenue from 100 lost visits of comparable value. It would still need to attract those extra visitors.
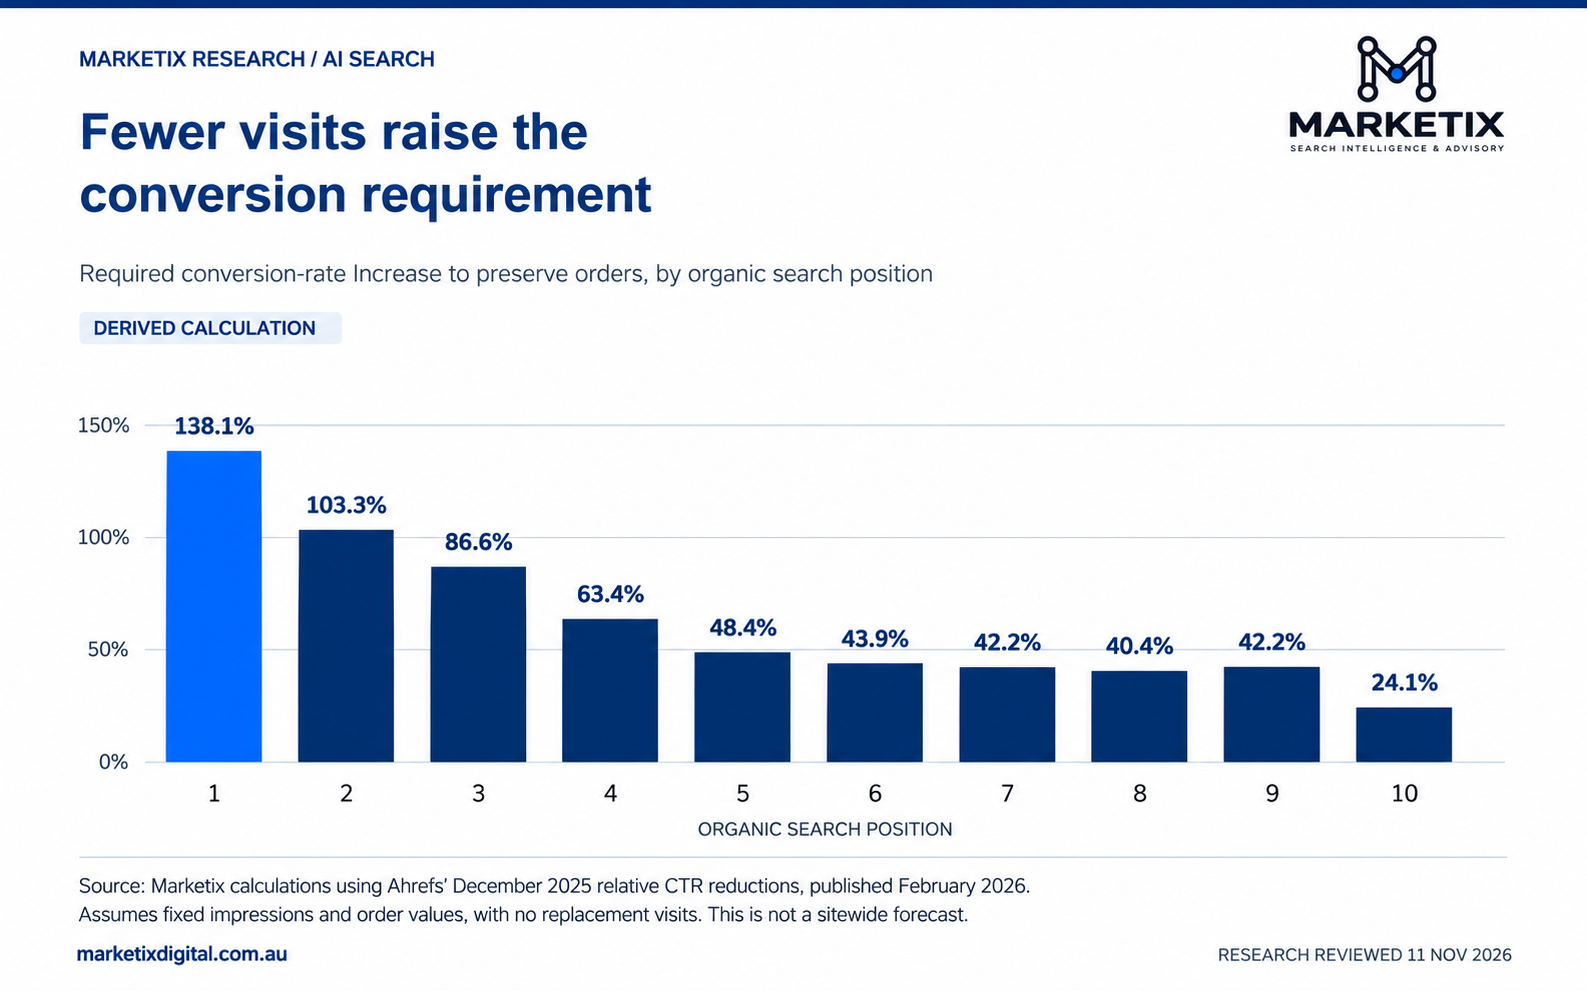
There is a separate challenge for the visitors who remain. If visits fall from 100 to 42, those 42 visitors must convert 2.38 times as often to maintain the same number of orders. That is a 138.1% increase in the conversion rate, assuming unchanged order values and no replacement traffic.
Figure 2. Marketix calculations from Ahrefs CTR benchmarks. Fixed impressions, unchanged order values and no replacement visits are assumed. [5]
The calculation also works in reverse. If every remaining visit generated 83% more revenue, a business could lose 45.4% of its visits and maintain the same revenue. That illustrates the trade-off between traffic volume and visitor value; it is not a prediction of what AI will deliver.
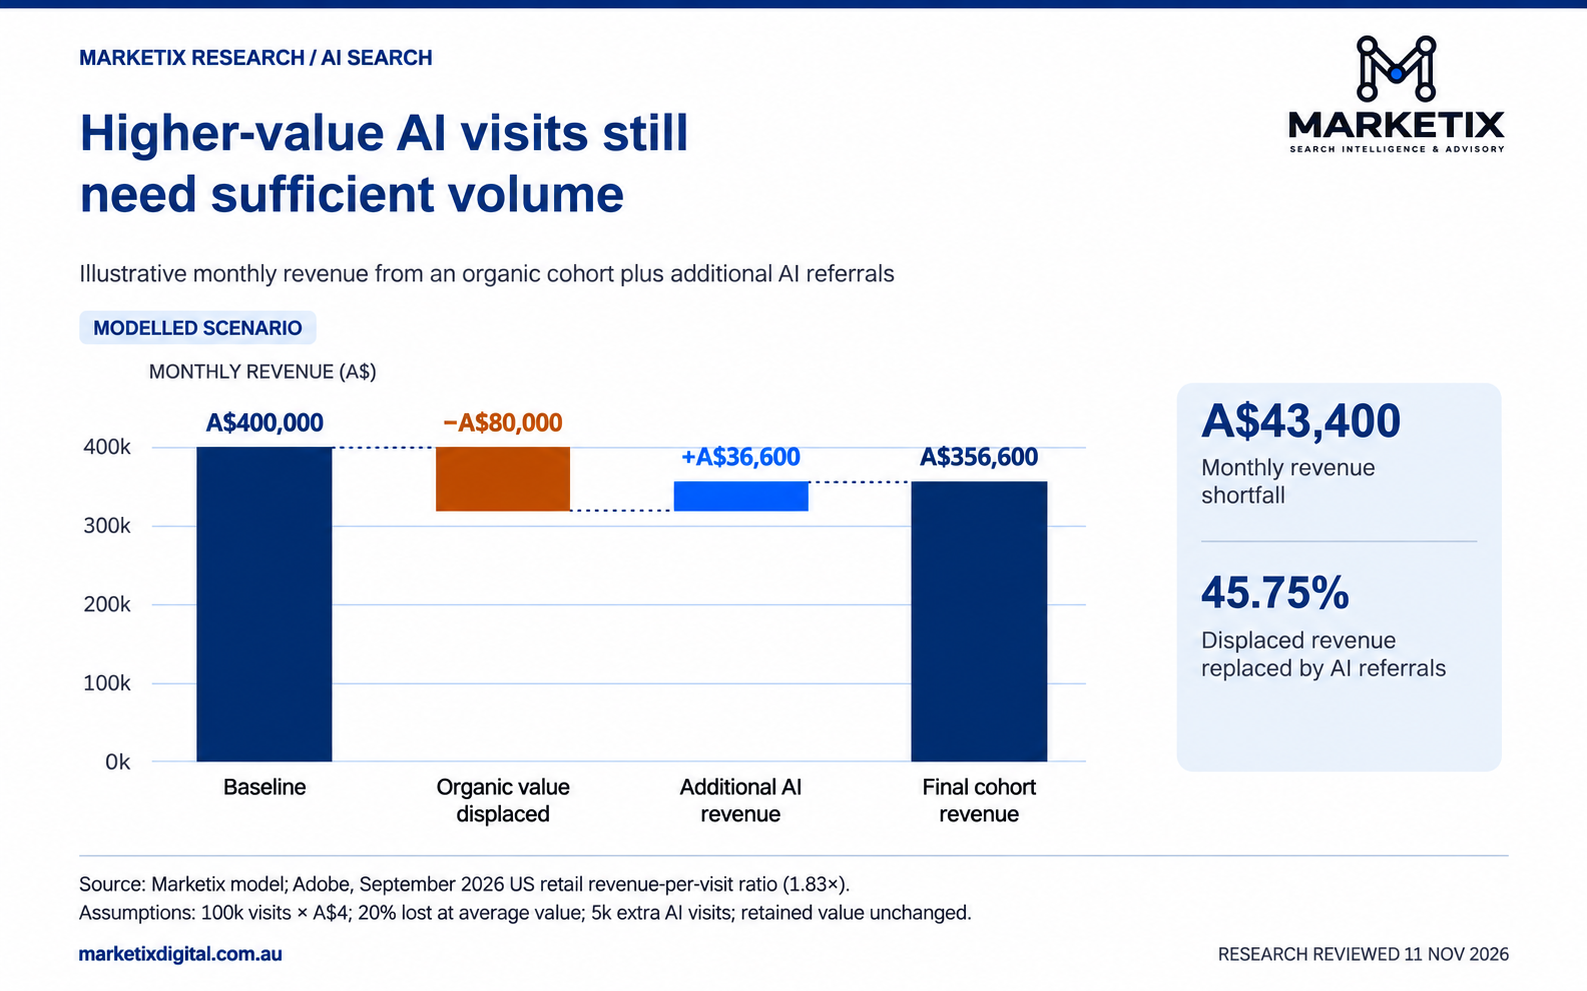
Consider a hypothetical business with 100,000 monthly organic visits generating A$4 per visit, or A$400,000 in revenue. It loses 20% of those visits and gains 5,000 additional AI referrals. For this example, assume the lost visitors were worth the organic average.
For the model, use Adobe's 1.83 revenue-per-visit ratio to value each additional AI visit at A$7.32. The table shows what happens under those assumptions.
| Measure | Modelled monthly result |
| Revenue displaced by 20,000 lost visits | A$80,000 |
| Revenue per additional AI visit | A$7.32 |
| Revenue from 5,000 additional AI visits | A$36,600 |
| Displaced revenue replaced | 45.75% |
| Direct-referral revenue shortfall | A$43,400 |
| Final revenue from the modelled cohort | A$356,600 |
| Additional AI visits needed to replace displaced revenue | Approximately 10,929 |
Figure 3. Illustrative monthly scenario: A$80,000 in lost organic revenue, A$36,600 added through AI referrals and a remaining A$43,400 shortfall. [1]
Replacing the lost revenue would require approximately 10,929 additional AI visits in total. With 5,000 already assumed, the business would still need about 5,929 more.
Costs raise the hurdle further. At a 30% contribution margin and A$2,000 in extra acquisition costs, monthly contribution would fall by A$15,020. The business would need approximately 11,840 additional AI visits to restore its original contribution after those costs.
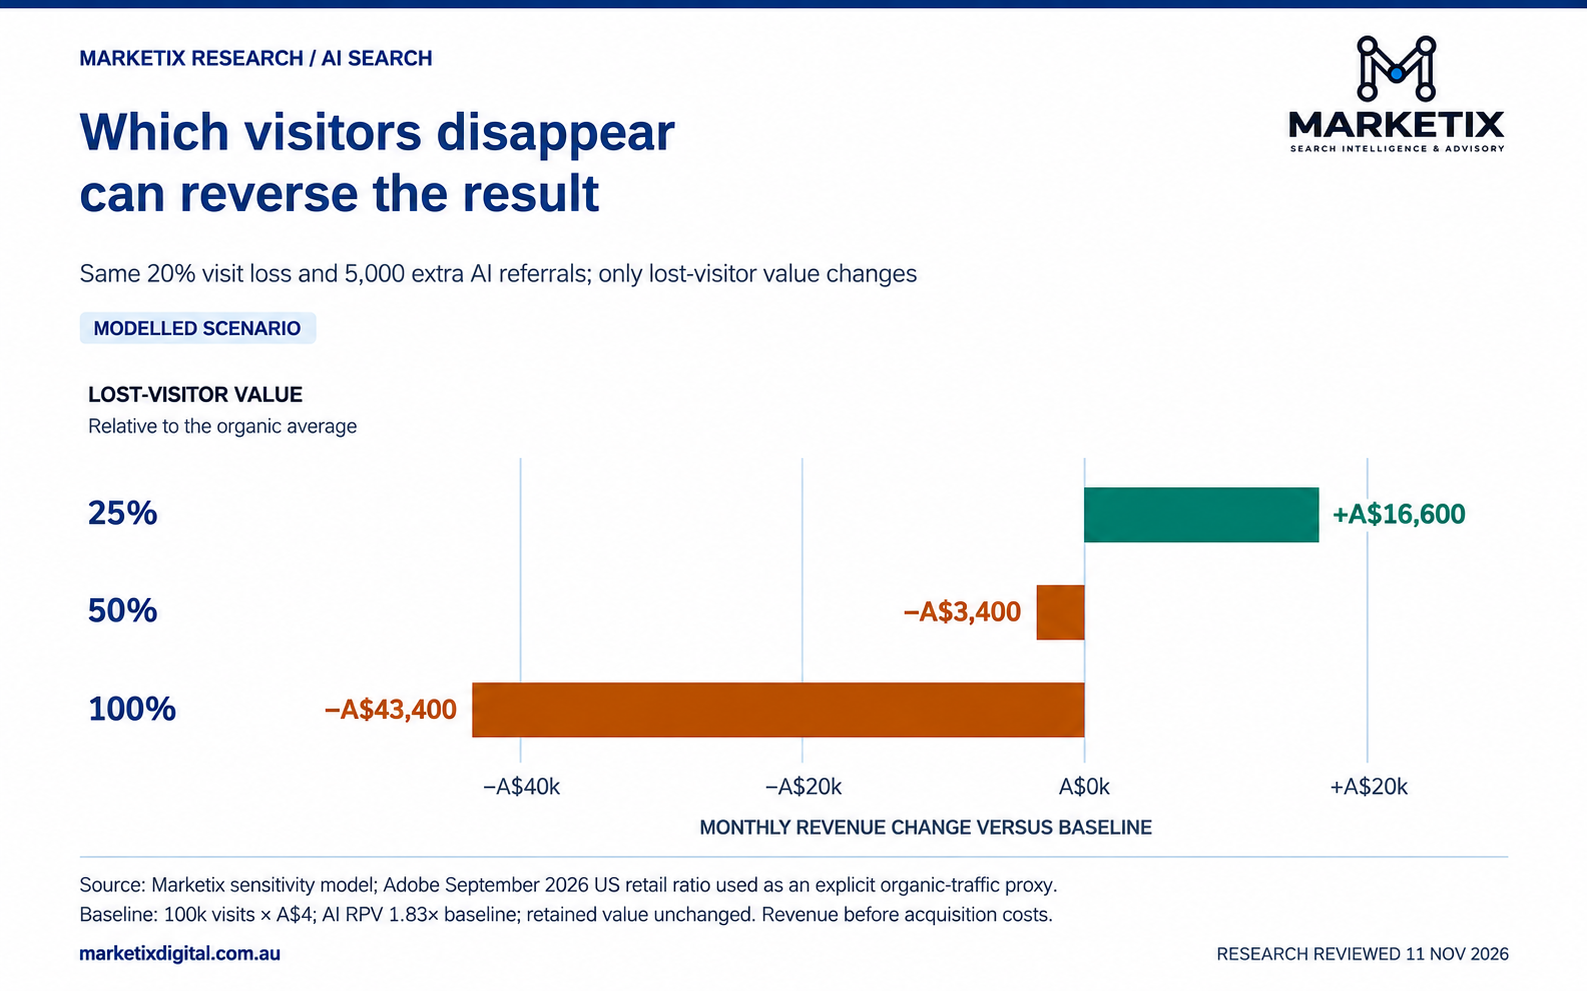
The result changes if the lost visitors were less valuable. At A$1 per lost visit, the same 20% traffic decline would remove A$20,000 in revenue. The A$36,600 from additional AI referrals would then more than replace it, leaving revenue A$16,600 higher before acquisition costs.
The traffic decline is identical, but the financial outcome is different. This is why a traffic-loss percentage alone cannot tell a business how much revenue is at risk.
| Lost-visit value relative to the organic average | Required additional AI visits at the model's A$7.32 per visit |
| 25% | 2,732 |
| 50% | 5,464 |
| 100% | 10,929 |
Figure 4. Changing the value of lost visitors changes the revenue outcome. All other model inputs stay the same; acquisition costs are excluded.
The accompanying workbook lets businesses test different traffic volumes, visitor values and costs using their own numbers. It also shows what happens if the remaining organic visitors become more or less valuable.
Begin with a category that matters commercially, such as a product family, hire service or high-margin enquiry type. Define its landing pages, brand and non-brand queries, geography and devices before reviewing the results. Use comparable periods and record promotions, pricing, stock availability, site migrations and tracking changes.
Separate four questions in the reporting:
1. Has demand changed? Compare searches for the category with impressions and business conditions. Check whether fewer people are searching or whether your website is appearing less often.
2. Has visibility changed? Track rankings, clicks and click-through rates for the same searches. Check how AI Overviews, shopping results and ads affect what customers see.
3. What business does the traffic generate? Measure qualified leads, orders, revenue and contribution. Track growth in AI referrals against the existing baseline.
4. How are customers finding you? Compare direct referrals with branded searches, overall category sales and what customers say influenced their decision. Count each sale once.
Google's generative AI report provides visibility data for AI Overviews and AI Mode. Use it to understand where the business appears, then use analytics and CRM data to assess enquiries and sales. [11]
Compare performance across the same pages, categories and periods. Search Console cannot tell you which individual search produced a particular sale, so use it alongside your commercial reporting.
For B2B businesses, allow enough time for enquiries to become sales. Demandbase reported that monthly ChatGPT referrals to the B2B websites it measured grew from roughly 645,000 in June 2025 to 2.6 million in June 2026. That growth makes the channel worth monitoring, while the commercial test remains the quality of the opportunities it brings. [12]
Measure qualified opportunities, eventual wins and their contribution to the business. A dust-monitoring enquiry, an equipment-hire lead and a low-value consumer question can have very different values.
A fall in clicks should prompt a review of which customers and revenue are affected. Losing early research visits has a different commercial impact from losing visibility for profitable products or high-value enquiries. The priority is to identify the demand worth defending and the opportunities worth pursuing.
Higher conversion rates can help, but they should not be assumed to offset a large traffic loss. The commercial response can combine stronger visibility for valuable searches, a more valuable traffic mix and better-performing commercial pages. SEO investment should be directed towards the products, services and markets where those improvements have a credible path to profitable sales.
AI search belongs in that assessment. Higher revenue per AI visit does not establish that enough additional visits are available to replace lost organic revenue. Test AI visibility against qualified enquiries, sales and credible evidence of assisted discovery. Fund a defined category test with a documented baseline, a realistic sales-cycle window and the full cost of the work. Increase investment where the evidence supports additional contribution after costs.
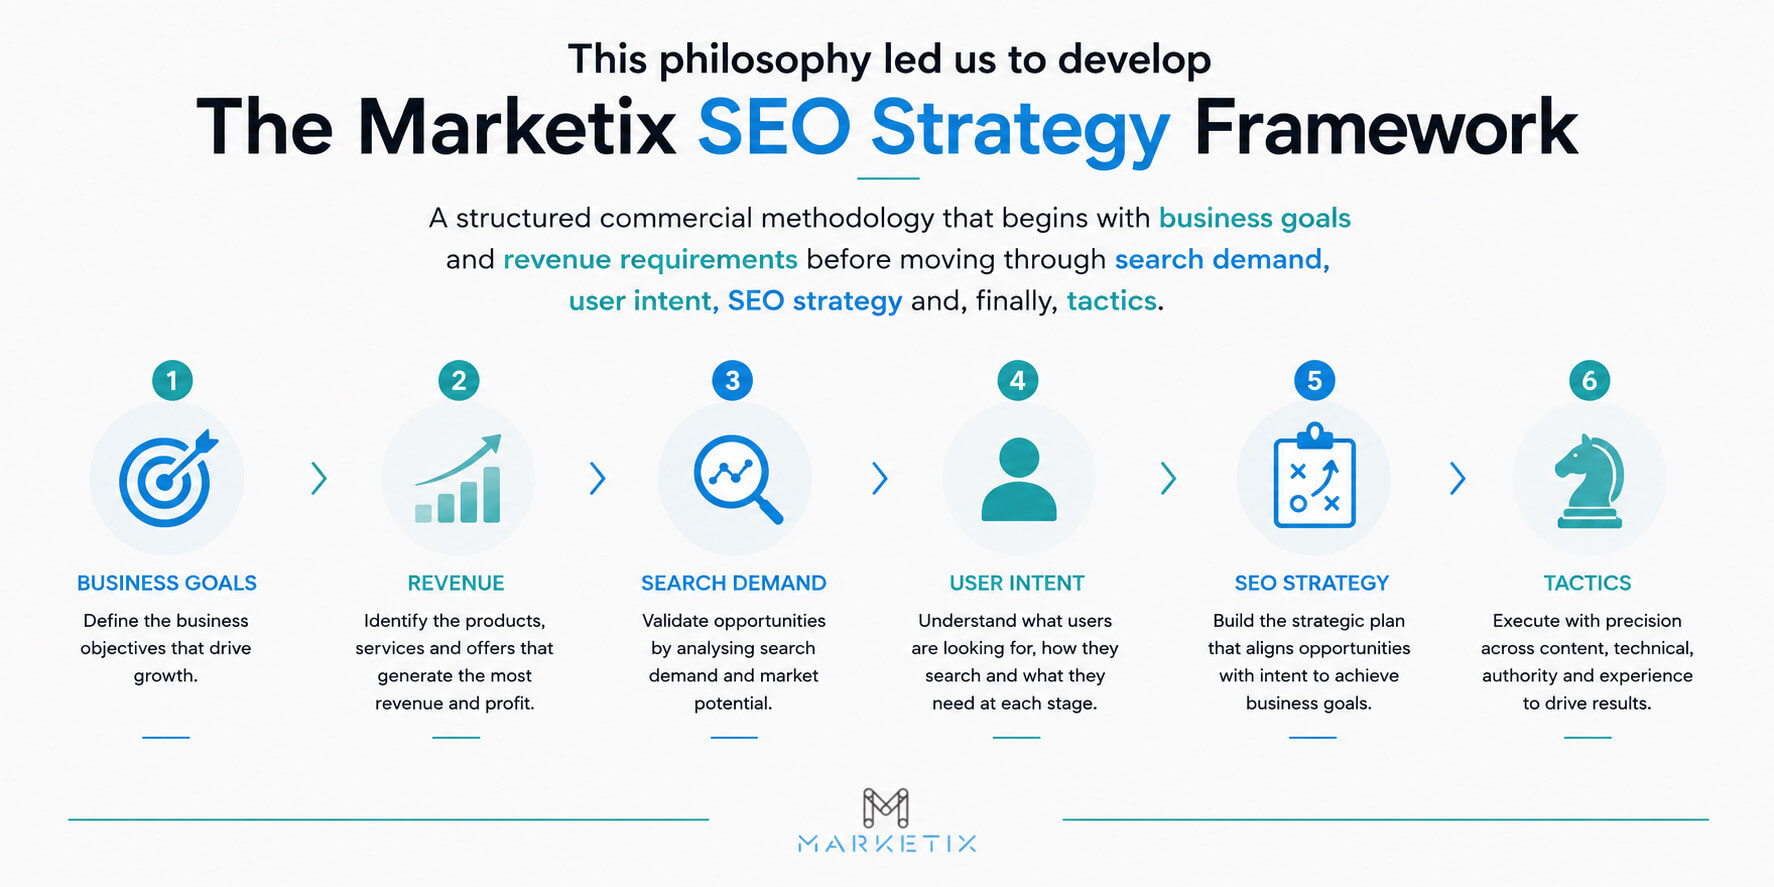
Marketix’s Search Intelligence & Advisory connects search demand, competitive visibility and customer economics to those decisions. It helps identify where the commercial opportunity sits, what would be required to compete and which SEO priorities deserve investment. The resulting strategy gives execution a commercial purpose and a basis for measuring its value.
Request an Investment Briefing to discuss where changing search behaviour creates risks or opportunities for your products, services and markets, and whether further analysis or SEO investment is warranted.
Marketix reviewed the research on 11 November 2026. The article combines published findings with an illustrative revenue model. It does not use client analytics or CRM records, and the examples are not forecasts for Australian businesses.
The workbook contains the inputs, formulas and supporting calculations. The notes below explain the scope of each source and the model assumptions.
Comparability. The studies cover different countries, periods and groups of websites or users. Their percentages should not be combined into a single estimate of Australian traffic or revenue losses. Adobe’s figures describe US retail visitors and do not establish that moving a visitor to AI search causes a revenue increase. IAB’s figure measures paid-search advertising revenue, not organic traffic value. [1, 2]
Traffic and buyer journeys. Ahrefs’ Web Analytics sites are a selected vendor dataset, not a representative Australian sample. Its source and channel categories overlap and cannot be added into a market-share total. Similarweb’s release does not provide enough detail to translate its shopping-research finding into Australian sales. Demandbase’s growth figures apply to its measured B2B websites and do not establish a conversion premium. [3, 4, 12]
Click studies. Ahrefs compared December 2023 and December 2025 desktop data against a trend-adjusted estimate of performance without AI Overviews. Its 58% result concerns position-one click-through rates, not a universal fall in website visits. Seer classified AI Overview queries retrospectively without a seasonality adjustment. The 80.2% rebound uses its appendix values; the widely quoted 85% uses more rounded inputs. [5, 6]
Further study limitations. Pew measured search visits, rather than ranking-position click-through rates, and matched March 2025 browsing with results collected in April. The France study used a short post-launch period and groups with different exposure levels. Wang’s preprint estimate adjusts for incomplete compliance: only 51.1% of AI Overviews were successfully hidden. These studies measured browsing or clicks, not business revenue. Google did not publish the underlying aggregate dataset with its traffic statement. [7–10]
Model assumptions. Adobe’s AI-to-non-AI revenue ratio is used as a proxy for AI-to-organic revenue in the examples. Other inputs are hypothetical. Lost visitors initially have the organic average value; retained visitor value is unchanged unless specified. The ranking-position conversion chart assumes fixed impressions, unchanged order values and no replacement visits. Contribution uses the stated margins and extra acquisition costs; it is not company net profit. The model does not assign unmeasured assisted sales to AI or assume that new AI sales are entirely additional to other channels.
Measurement. Search Console’s generative AI report does not provide a dedicated AI revenue field. Its dates use Pacific Time, and page/property aggregation and missing-query data require care when comparing exports. Queries cannot be directly matched to individual analytics sessions or sales. Compare consistent groups of pages and periods, retain source totals and investigate discrepancies. [11]
[1] Adobe, 29 October 2026, September US retail observations. Read source
[2] IAB Australia/PwC, 31 August 2026, FY26 advertising revenue. Read source
[3] Ahrefs, AI vs Search Traffic Analysis, updated 10 November 2026, October observations. Read source
[4] Similarweb, State of Ecommerce 2026 release, 10 September 2026. Read source
[5] Ahrefs, 4 February 2026, December 2025 CTR study. Read source
[6] Seer Interactive, 24 April 2026, appendix actuals through February 2026. Read source
[7] Pew Research Center, 22 July 2025, US browsing study. Read source
[8] Ahrefs, 16 September 2026, France launch analysis. Read source
[9] Wang et al., 18 August 2026, preprint, March experiment. Read source
[10] Google/Liz Reid, 6 August 2025, aggregate traffic statement. Read source
[11] Google Search Console Help, checked 11 November 2026. Read source
[12] Demandbase, 12 August 2026, B2B referral research. Read source
Media enquiries: Shoaib Mughal, Managing Director, Marketix Digital. [email protected].

Recent Posts