Marketix analysis reveals a sustained decline in searches for David Jones before this morning’s administration news, alongside weaker department-store sales within a growing shopping-centre portfolio.
Marketix Digital research | 5 November 2026
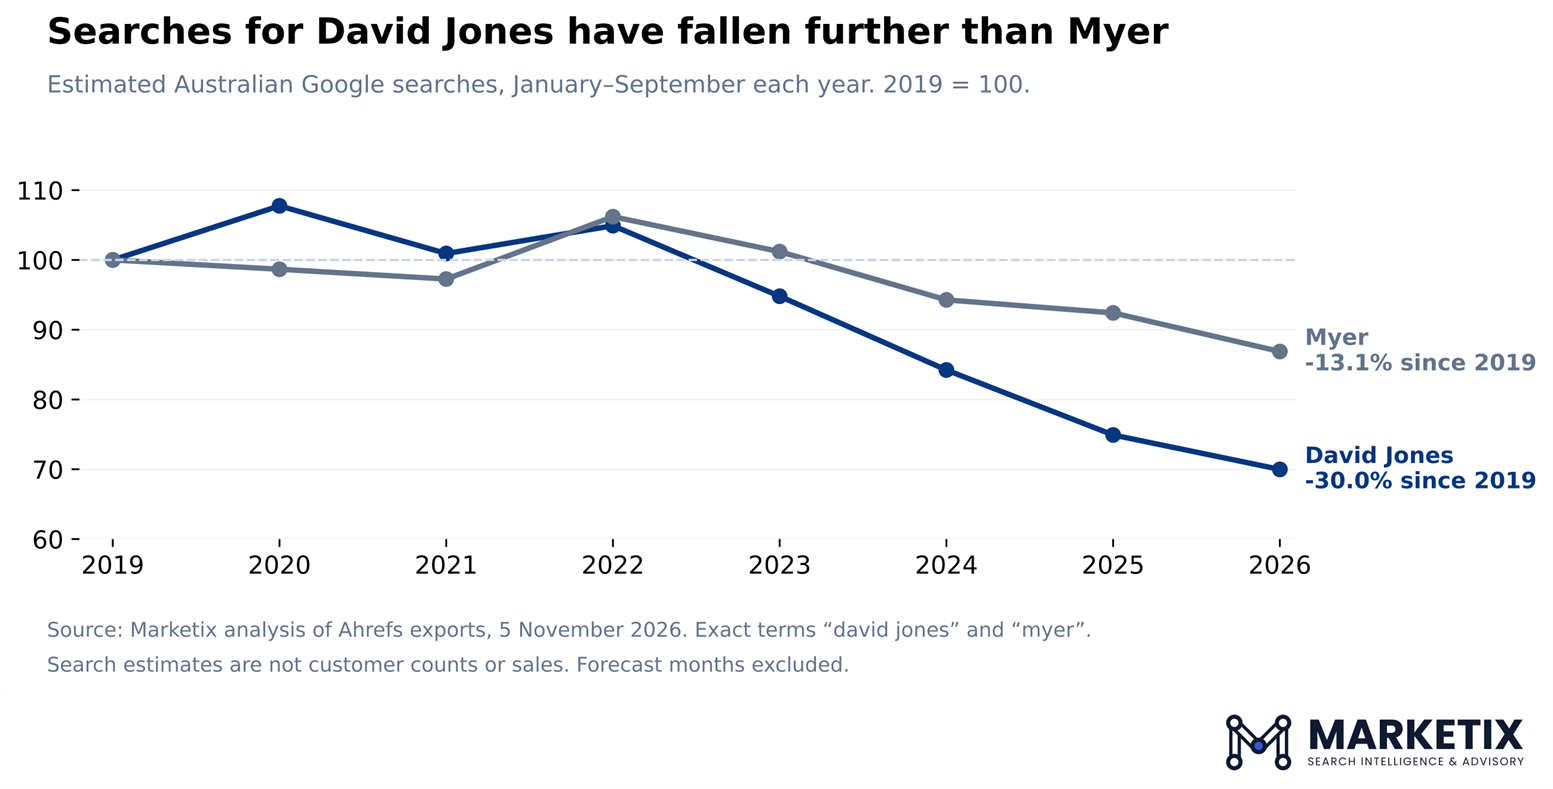
David Jones entered administration and receivership on Thursday morning with a long decline in searches for its name already evident. Marketix analysis of Ahrefs estimates found Australian Google searches for “david jones” were 30.0 percent lower in January to September 2026 than in the same months of 2019. Searches for “myer” were down 13.1 percent over that period.
Inside Retail reported on 5 November that McGrathNicol had been appointed voluntary administrators and FTI Consulting receivers and managers. The appointments followed unsuccessful negotiations with landlords over the retailer’s future.
The search history adds context to that immediate crisis. It ends in September, before this week’s headlines, and sits alongside a sharp divide in retail performance: department-store sales fell within Vicinity Centres’ portfolio during a quarter when sales across the portfolio grew. The search figures measure estimated searches for the two retailer names, rather than customer numbers or revenue.
Estimated searches for “david jones” fell from 6.35 million in the first nine months of 2019 to 4.44 million in the corresponding months of 2026, a reduction of approximately 1.91 million. Myer’s estimated searches fell from 7.70 million to 6.69 million.
Searches for David Jones have fallen further than Myer over the comparison with 2019.
David Jones’ trend was uneven through the pandemic, with January-to-September searches above the 2019 baseline in both 2020 and 2022. They then fell in each subsequent year. By 2026, its percentage decline from 2019 was more than twice Myer’s.
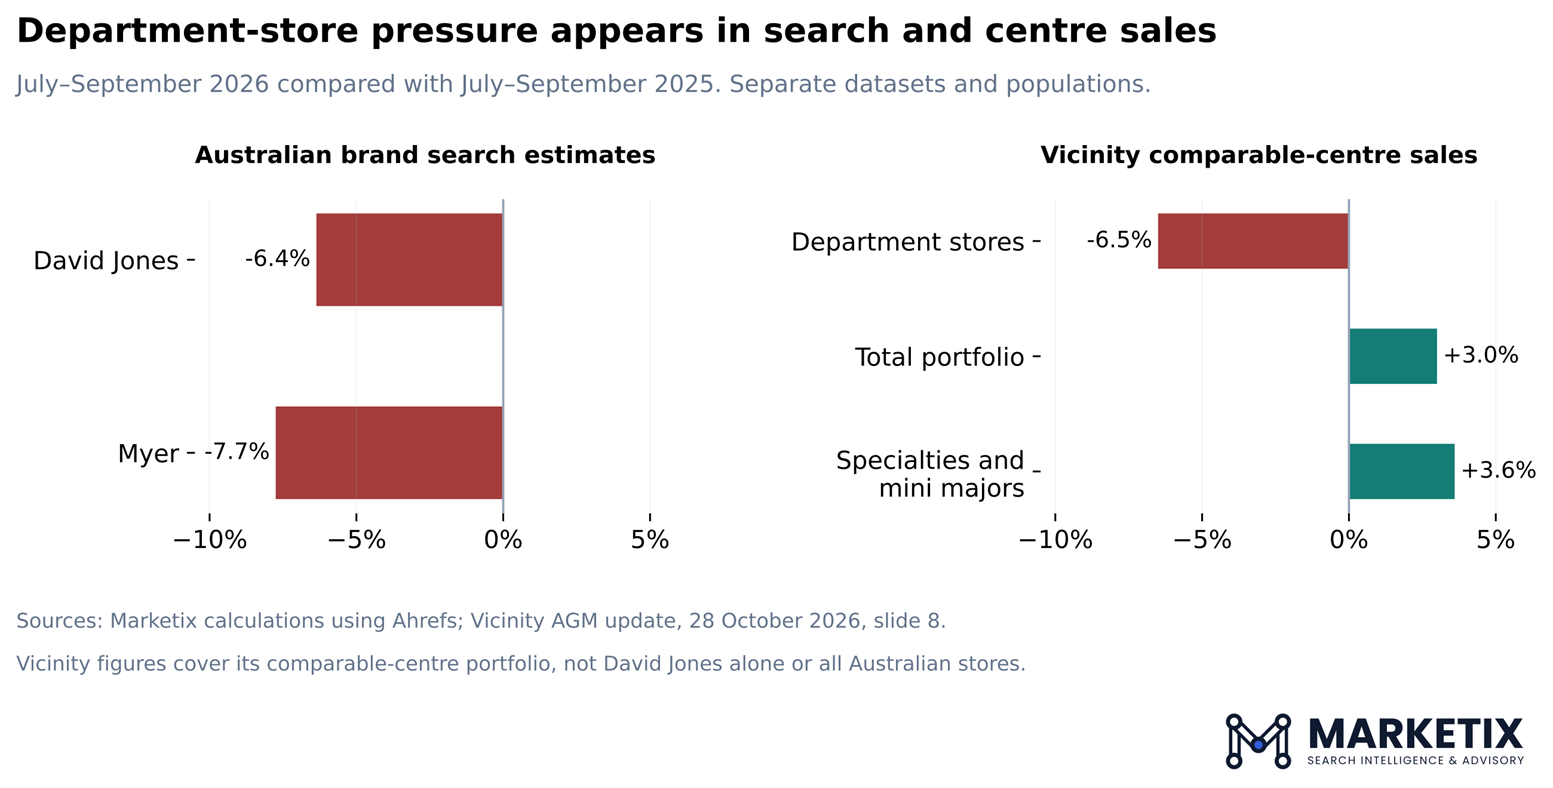
The latest quarter shows pressure on both names. Searches for “david jones” fell 6.4 percent year on year in July to September 2026, while “myer” fell 7.7 percent. David Jones therefore recorded the steeper long-term fall, but Myer’s decline was greater in the most recent quarter.
Vicinity’s September-quarter update reported a 6.5 percent year-on-year fall in department-store sales across its comparable-centre portfolio. Total portfolio sales rose 3.0 percent, while specialties and mini majors grew 3.6 percent.
That leaves a 9.5 percentage-point gap between department-store and total portfolio sales growth. Within those centres, department stores were contracting while the wider tenant mix was growing. The figures cover Vicinity’s comparable centres, rather than David Jones alone or every Australian department store.
Search and sales measures show department-store pressure in the same quarter, across separate populations.
Separate evidence from Scentre Group’s 4 November operating update also shows spending continuing in physical shopping destinations. Tenant sales across its Australian and New Zealand portfolio increased 3.5 percent in the September quarter. Visits rose 3.2 percent from the start of the year to 1 November.
Online spending was expanding too. CommBank iQ data published by Commonwealth Bank put Australian online spending at $25 billion in July to September, up 17 percent year on year. The average online basket fell 6.8 percent to $90, indicating that higher total spending came alongside smaller transactions.
Marketix’s interpretation is that department stores faced pressure within a retail market that still offered growth in both physical destinations and online shopping. These separate datasets show diverging performance; they do not trace spending from David Jones to particular competitors.
The company results help explain why sales growth alone gives an incomplete view of trading conditions. Myer’s FY26 results show Myer Retail sales, including concessions, rose 0.7 percent to $3.33 billion in the 52 weeks ended 25 July 2026. Online sales grew 4.2 percent, but operating gross profit margin fell from 35.9 percent to 35.2 percent.
Myer attributed the margin decline to a greater contribution from concessions and increased promotional activity to stimulate demand. That provides a commercial distinction: a retailer can generate more sales while retaining less operating gross profit from each sales dollar.
David Jones had also reported areas of improvement earlier in the year. Ragtrader reported in April that its total sales rose 3.6 percent and online sales rose 10 percent in the nine months to March 2026. The same report cited a $95.5 million pre-tax loss for FY25. These cover different periods and do not provide a current-quarter David Jones result, but they show why this morning’s outcome cannot be reduced to a single declining measure.
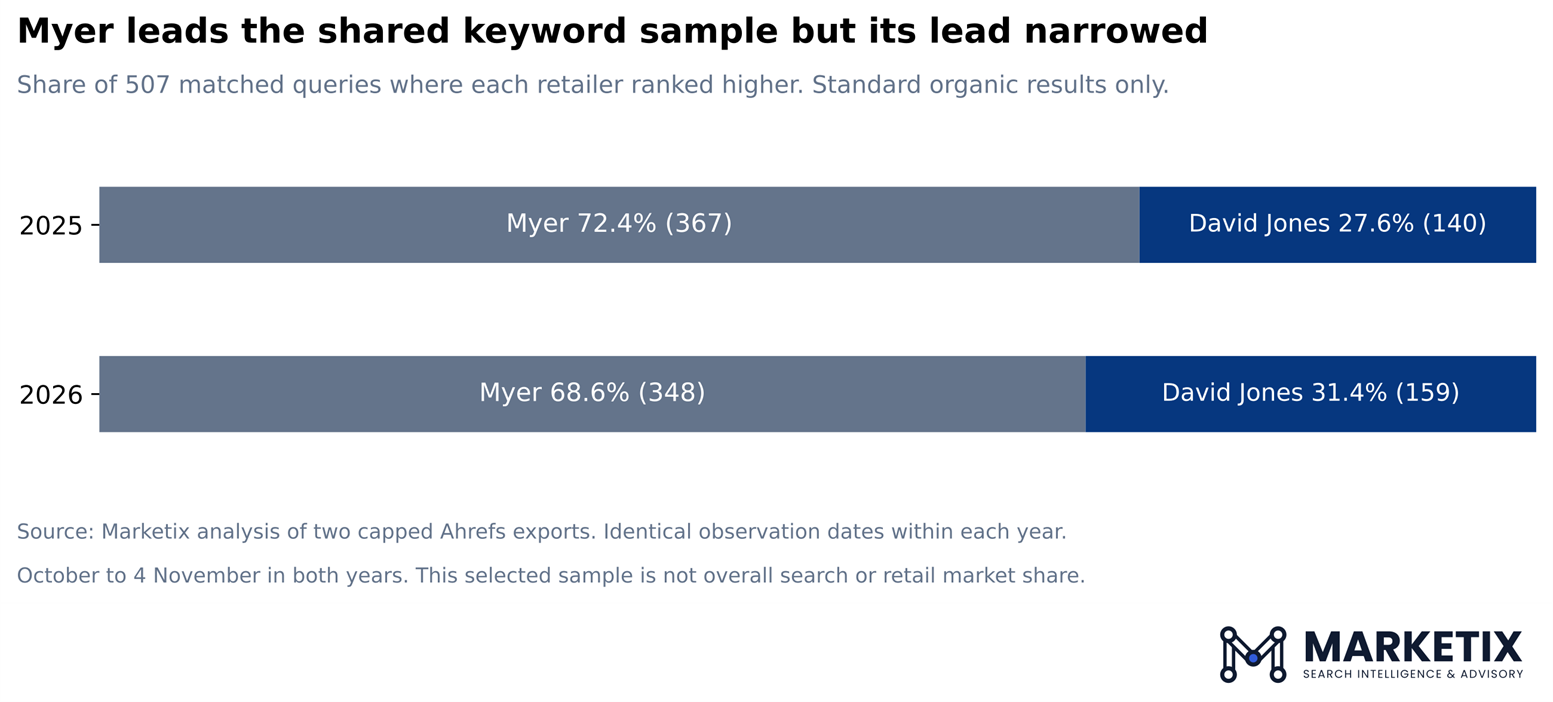
Myer still leads the 507-query matched sample, but David Jones increased the number of queries on which it ranked higher.
For “tommy hilfiger australia”, David Jones improved from sixth to second while Myer remained fourth. For “dior makeup”, David Jones slipped from third to eighth and Myer moved from fourth to fifth. Results varied by query, but the overall matched sample shows David Jones narrowing Myer’s lead.
This selected sample cannot measure total Google visibility. It does, however, challenge an explanation based on David Jones simply losing rankings to Myer: fewer searches for the retailer’s name occurred alongside relative gains on some product searches.
The contribution of this analysis is the history preceding the administration. David Jones entered this week’s crisis with substantially fewer estimated searches for its name than before the pandemic. Recent declines for both department-store names also coincided with weaker department-store sales inside a major shopping-centre portfolio.
For any future owner, the commercial question extends beyond maintaining a presence in Google. It is how to turn consumer interest and available retail spending into sustainable earnings. The evidence shows the scale of the challenge, while the administrators’ and receivers’ work will determine the business’s immediate future.
Marketix summed Ahrefs’ monthly Australian Google search-volume estimates for the exact terms “david jones” and “myer”, comparing January to September in each year. The latest-quarter comparison uses July to September 2026 against the same months of 2025. All search-volume calculations stop at September 2026; later rows and forecast months were excluded.
The ranking comparison uses two capped 30,000-row Australian exports. Marketix retained 507 shared non-retailer-branded queries with standard organic positions and identical observation dates between the retailers within each year, from 1 October to 4 November. Missing positions and special search-result types were excluded. This is a selected sample, not overall search or retail market share.
Search estimates may be revised and do not capture all brand queries, app use, direct visits or purchases. Company financials, landlord sales and bank-panel spending cover different populations and periods; spending figures are nominal. Together they provide context, without establishing customer switching or the causes of insolvency.
Media enquiries: Shoaib Mughal, Managing Director, Marketix Digital. [email protected].

Recent Posts
Recent Posts