

AI search investment demands clear evidence on traffic, customer value and revenue. Marketix Digital combines authoritative datasets to quantify the opportunity and the scale of the revenue-replacement challenge.
Research and analysis by Marketix Digital · Evidence reviewed 13 November 2026
AI adoption, brand visibility, website referrals and revenue measure different stages of customer discovery. Conflating them distorts the business case for AI search.
Marketix Digital connects referral volumes with commercial performance, recalculates prominent click statistics and tests the revenue implications. This analysis gives Australian business leaders, marketers and SEO teams a defensible basis for assessing AI search investment.
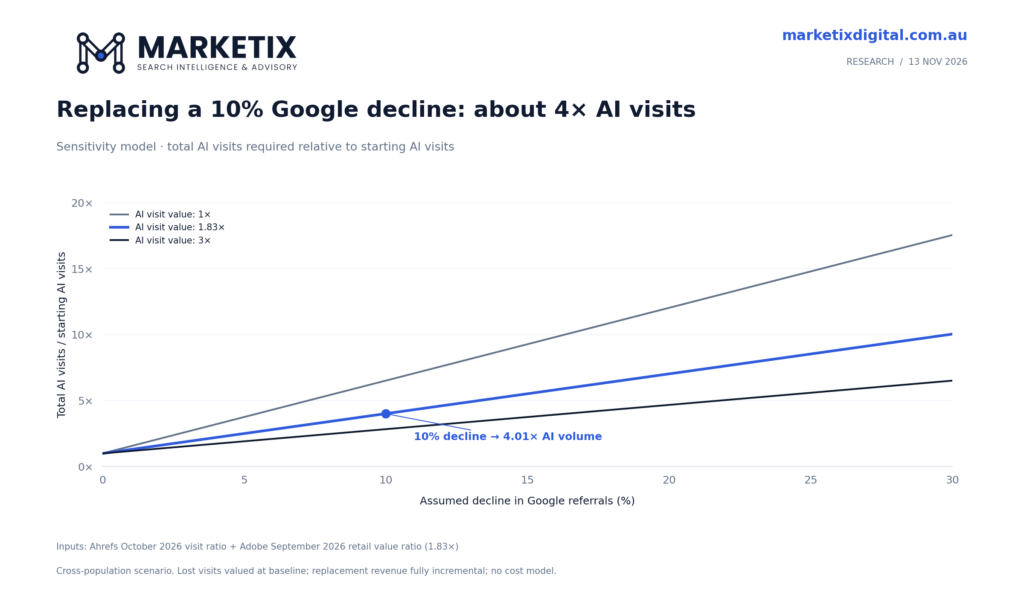
Marketix Digital’s central finding: our benchmark scenario requires AI referrals to reach approximately four times their starting volume to offset a 10% decline in Google referrals. The calculation combines Ahrefs’ October 2026 referral mix with Adobe’s September 2026 US retail revenue-per-visit benchmark. It quantifies the replacement requirement under stated assumptions; it does not predict traffic losses or future AI growth.
AI search statistics at a glance
| Statistic | What it measures | Source and observation period |
|---|---|---|
| 297.8 million Google visits; 5.4 million AI-assistant visits | Referrals in a fixed panel of 118,671 websites | Ahrefs, October 2026 [1] |
| Approximately 55:1 | Google-to-AI visit ratio, calculated from those rounded volumes | Marketix Digital calculation from [1] |
| 8% versus 15% | Traditional-result clicks on Google visits with versus without an AI summary | Pew Research Center, March 2025 browsing [2] |
| About 58% lower | Position-one desktop CTR relative to a modelled no-Overview baseline | Ahrefs, December 2025 [3] |
| 1.31% → 2.36% | AIO-present organic CTR, December 2025 to February 2026 | Seer Interactive, published data table [4] |
| 83% higher revenue per visit | AI-referred versus non-AI US retail visits | Adobe, September 2026 [5] |
| 90% higher conversion rate | Purchasing visits in the same retail comparison | Adobe, September 2026 [5] |
| Approximately 303% growth | ChatGPT referrals to measured B2B properties, year on year | Demandbase, June 2025 to June 2026 [6] |
| 89% also used search | Overlap reported for AI-assisted shopping research | Similarweb, September 2026 report [7] |
1. Google still sends substantially more measurable traffic
Ahrefs’ fixed website panel compares both channels in the same month. Marketix Digital divides Google’s 297.8 million referrals by the 5.4 million from AI assistants: approximately 55 Google referrals for every AI referral. [1]
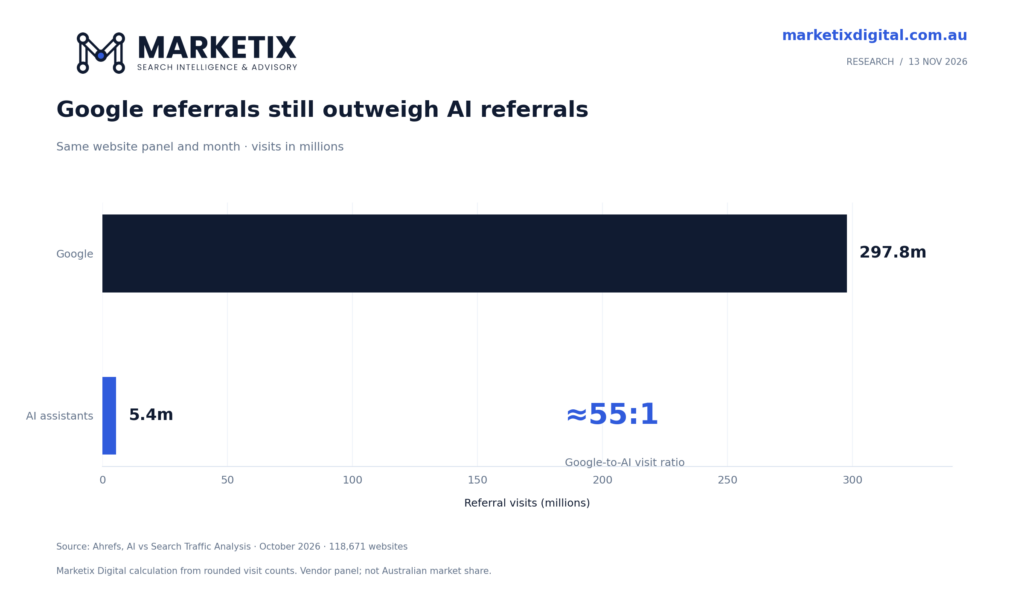
The ratio measures referral volume. AI usage, purchase influence and Google’s AI-feature coverage require separate measures. Classify clicks by their recorded source: a Google AI experience does not automatically turn a Google referral into a standalone assistant referral.
Starting volume determines the commercial significance of growth. Rapid expansion from a small base does not, by itself, offset losses from a much larger channel. Assess growth percentages alongside the number of visits they represent.
Ahrefs samples its Web Analytics users; the panel does not establish Australian market share. We calculate from displayed visit counts throughout. The dashboard’s rounded percentage shares produce a slightly different ratio, and its overlapping channel categories preclude a valid 100% traffic pie chart.
2. Click studies measure specific patterns, not a universal traffic loss
Pew Research Center examined 68,879 Google searches by 900 US adults. Traditional-result clicks occurred on 8% of visits with an AI summary and 15% without one. That is a seven-percentage-point difference, or a 46.7% relative reduction. Summary-source clicks occurred on 1% of visits with a summary. [2]
Pew matched March browsing against search results it collected in April. That timing prevents exact reconstruction of every participant’s original results. The observational study measures actions after search-page visits, rather than CTR at an individual ranking position.
Ahrefs used a different design: 300,000 keywords, aggregated desktop Search Console data and December 2023 versus December 2025 comparisons. Its approximately 58% figure compares observed position-one CTR with a baseline adjusted for the decline among informational keywords without an Overview. The 58% measures an association against that modelled baseline. It does not measure a decline across all organic traffic. [3]
Averaging these percentages conflates a user’s next action with a page’s clicks per impression. Applying either directly to total company revenue compounds that error.
3. CTR recovery makes a straight-line decline forecast unreliable
Seer Interactive’s April 2026 study covers 53 brands and 2.43 billion organic impressions. Its appendix reports AIO-present organic CTR rising from 1.31% in December 2025 to 2.36% in February 2026. Marketix Digital calculates an 80.2% relative increase from the table, equivalent to 1.05 percentage points. [4]
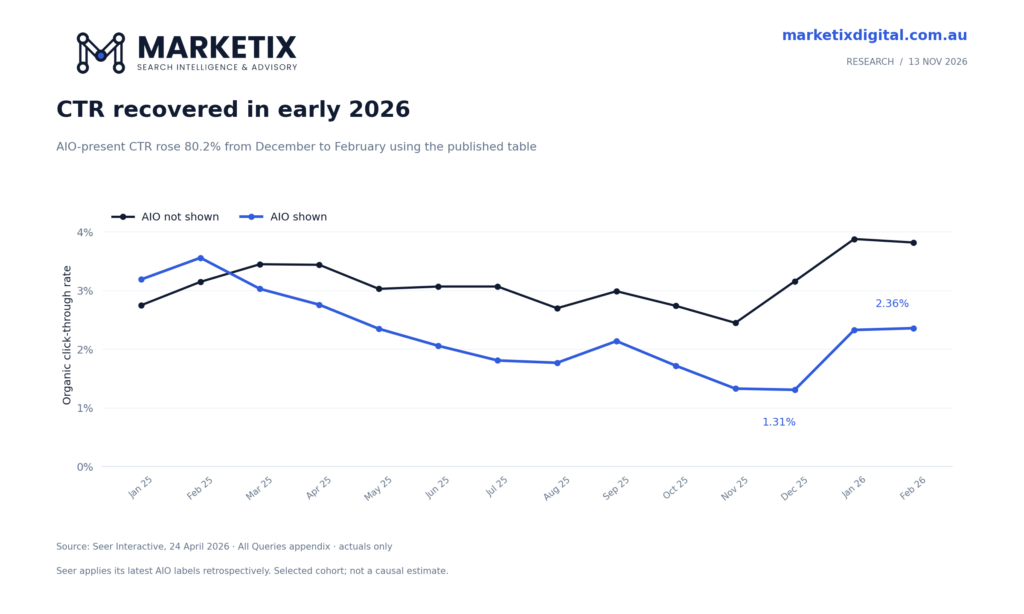
The article’s headline uses 85%, based on rounded endpoints. We use the more precise table. February’s 2.36% remained 26.0% below January 2025’s 3.19%. The rebound recovered part of the earlier decline.
Seer applies its latest AIO classification retrospectively across a selected brand cohort. That method limits what the series establishes about exposure over time. The recovery demonstrates why one period’s decline cannot justify an indefinite downward forecast.
Keep impressions, clicks and conversion outcomes visible together. A CTR decline caused by expanding impressions requires a different response from falling clicks on a stable set of valuable queries.
4. Adobe’s conversion premium exceeds its revenue premium
Adobe reports that, in September 2026, AI-referred US retail visits generated 83% more revenue per visit and converted 90% better than non-AI visits. Its analysis covers more than one trillion visits, 100 million SKUs and 18 product categories. [5]
Revenue per visit = purchasing visits ÷ visits × revenue per purchasing visit
Marketix Digital divides Adobe’s revenue ratio by its conversion ratio: 1.83 ÷ 1.90 = 0.963. The result implies approximately 3.7% lower revenue per purchasing visit, provided both ratios use the same population, weighting and purchase definition.
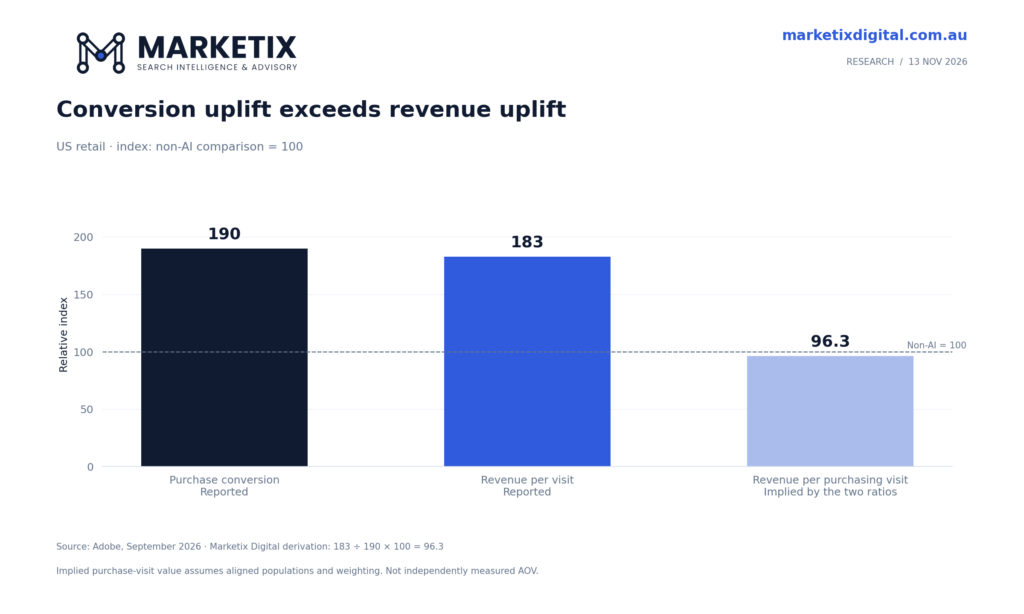
This derivation measures implied revenue per purchasing visit. Equating it with average order value also requires aligned order-count definitions. Adobe’s conversion premium alone does not establish larger transactions.
Assess purchase conversion, transaction value, margin and repeat purchase separately. Then account for acquisition costs and returns. Revenue per visit measures sales yield; contribution measures what remains after the relevant costs.
5. Combining traffic and value data exposes the scale of the replacement task
We combine two published inputs to calculate the additional AI traffic required to replace revenue from lost Google referrals.
The model uses Ahrefs’ October 2026 traffic ratio and Adobe’s September US retail value premium. Adobe compares AI with all non-AI traffic, while Ahrefs measures a mixed website panel. We explicitly assume that Adobe’s 1.83 multiplier applies to Google referrals for this scenario; the source datasets do not establish that equivalence.
We scale the traffic mix to 10,000 Google referrals and approximately 181 starting AI visits. This normalisation preserves the source ratio and makes the calculation reproducible.
- A 10% Google decline removes 1,000 visits.
- Assume each lost visit has the baseline Google revenue value.
- At 1.83 times that value, replacing the lost revenue requires approximately 546 additional AI visits.
- Adding these to the existing 181 AI visits produces approximately 728 visits: 4.01 times the starting AI volume, equivalent to about 301% growth.
The baseline already includes existing AI revenue. Counting it again as replacement revenue understates the growth requirement.
| Assumed Google referral decline | Extra AI visits per 10,000 initial Google visits | Total AI volume required versus starting AI volume |
|---|---|---|
| 5% | 273 | 2.51× |
| 10% | 546 | 4.01× |
| 20% | 1,093 | 7.03× |
| 30% | 1,639 | 10.04× |
Marketix Digital sensitivity calculations. All rows use the same starting mix, a constant 1.83 relative visit value and fully incremental replacement revenue. We round each output independently.
The result changes when the lost visitors have a different value
Value the visits that disappear according to their commercial role. Do not assign the same immediate revenue value to an early research visit and a branded product visit without evidence. For the same 10% traffic decline, halving the assumed value of lost visits reduces the required total AI volume to about 2.51 times its starting level. Doubling that value increases the requirement to about 7.03 times.
These sensitivity settings test the model’s dependence on visitor value; they do not assign probabilities. The model holds retained-visitor value, margins and acquisition costs constant and credits additional AI visits with replacing lost revenue. If only half that replacement revenue is incremental, the extra traffic requirement doubles.
The model quantifies the growth hurdle. Establishing actual traffic losses, their causes and achievable AI growth requires business-level evidence. Our related analysis, Can AI search replace the revenue behind lost clicks?, examines the wider commercial replacement problem.
6. B2B ChatGPT referrals grew 303%; pipeline performance needs its own evidence
Demandbase reported ChatGPT referrals rising from roughly 645,000 in June 2025 to 2.6 million in June 2026 across the B2B properties it measures. That is about 303% growth. Its wider research dataset spans more than 11 billion visits and 1,584 customer instances. [6]
Demandbase’s referral growth does not establish equivalent growth in qualified opportunities or won revenue. Its customer-instance count does not establish a website count, and its multi-month visit total cannot supply the denominator for one month’s referral share.
For an industrial or enterprise business, the appropriate commercial chain is:
Visits × enquiry rate × qualification rate × win rate × average deal value
Weaker qualification or lower deal values can erase the benefit of a higher enquiry rate. Conversely, a small number of high-value opportunities can justify investment. Use CRM outcomes to establish the commercial result.
Effective enterprise SEO connects search visibility with account quality, pipeline and the buying cycle. A retail revenue multiplier cannot substitute for that evidence.
7. AI influence and last-click traffic measure different parts of discovery
Similarweb’s September 2026 ecommerce release reports that consumers using AI for shopping research also used search 89% of the time. The statistic measures overlap within AI-assisted shopping research. It does not measure AI adoption across all shoppers. The release does not provide enough detail to reconstruct that measure’s sampling uncertainty. [7]
Platform activity is another separate measure. OpenAI’s 2025 consumer-usage research, based on 1.5 million conversations, classified 49% of messages as “Asking”, 40% as “Doing” and 11% as “Expressing”. Those are task categories, not counts of web searches or outbound referrals. [8]
These measures do not establish AI’s share of commercial search. Message counts alone identify neither external searches nor outbound clicks. Last-click attribution also omits earlier AI influence when a customer completes the journey through a later branded search.
Investigate cross-channel influence through customer research and CRM discovery questions. Record it separately from attributed revenue and deduplicate sales before calculating channel totals.
8. Platform totals and business performance require separate analysis
In August 2025, Google’s Head of Search, Liz Reid, said aggregate organic clicks to websites were relatively stable year on year. Google defined improved click quality in terms of users not returning quickly, rather than revenue or conversions. The statement did not supply an underlying dataset for independent reproduction. [9]
This platform-wide claim concerns a different scope and period from a selected keyword study or a particular business’s traffic loss. Total clicks depend on search volume and query composition as well as CTR. A decline in one measure does not determine the aggregate outcome.
An aggregate platform statement does not invalidate a company’s measured decline. A company’s decline does not establish a collapse across the whole web. Analyse each claim at the scale its evidence supports.
What Australian businesses must measure
International benchmarks define the questions. First-party data determines the investment decision. None of these datasets establishes a representative AI-search revenue benchmark for Australian businesses.
| Decision | Evidence to assemble | What it resolves |
|---|---|---|
| Which search activity deserves protection? | Page groups, query intent, clicks, revenue and qualified pipeline | Whether exposure sits in commercially valuable demand |
| Is AI sending valuable visitors? | Identifiable referrals, landing pages, transactions and CRM outcomes | Channel volume and realised value |
| Is visibility influencing buyers? | A documented prompt sample, citation checks and customer interviews | Evidence of discovery beyond directly attributed clicks |
| Is investment adding business value? | Comparable cohorts, costs, contribution margin and deduplicated sales | Whether gains are additional and commercially worthwhile |
Record dates, devices, markets and measurement rules before comparing periods. Segment branded and non-branded demand. For longer sales cycles, allow opportunities time to mature before declaring a channel stronger or weaker.
An effective AI SEO strategy connects accurate, discoverable business information with measurable commercial demand. Set investment priorities from the opportunity, customer economics and performance evidence. The Marketix SEO Strategy Framework explains how we work from business goals through revenue priorities, search demand and intent.
Methodology and calculation notes
Marketix Digital reviewed nine primary-source publications or dashboards, retained their observation periods and checked the compatibility of their units and populations. We then calculated derived metrics and built a transparent sensitivity model. This work analyses published aggregates; it does not include a new representative survey or independent validation of vendor raw data.
We distinguish three evidence classes: reported observations, calculations within a source and conditional modelling across sources. The combined model connects published aggregates. It generates reproducible scenario outputs without claiming new observed market measurements.
| Calculation | Reproducible expression |
|---|---|
| Google-to-AI referral ratio | 297.8 ÷ 5.4 ≈ 55.1 |
| Pew traditional-click relative difference | (15 − 8) ÷ 15 × 100 ≈ 46.7% |
| Seer December–February CTR rebound | (2.36 ÷ 1.31 − 1) × 100 ≈ 80.2% |
| Implied revenue per purchasing visit | 1.83 ÷ 1.90 ≈ 0.963 of the comparison level |
| Additional AI visits required | G × d × q ÷ (m × i) |
| Required total AI volume as a multiple of baseline | 1 + G × d × q ÷ (A × m × i) |
Here, G and A are starting Google and AI visits; d is the assumed Google decline; q is lost-visitor value relative to baseline Google value; m is additional AI-visitor value relative to that same baseline; and i is the fraction of replacement revenue that is incremental. The central case uses d = 0.10, q = 1, m = 1.83 and i = 1.
We retain calculation precision and round only the displayed results. The sources do not supply the matched sampling information needed for a valid confidence interval around the combined model. We selected sources for disclosed methods, identifiable publishers and commercial relevance; this targeted review does not claim systematic coverage of every study.
Sources
- Ahrefs. AI vs Search Traffic Analysis. Dashboard updated 12 November 2026 when retrieved. Observation period: October 2026.
- Pew Research Center. Google users are less likely to click on links when an AI summary appears in the results. 22 July 2025. Observation period: March 2025 browsing; results collected 7–17 April 2025.
- Ahrefs. Update: AI Overviews Reduce Clicks by 58%. 4 February 2026. Observation period: December 2023 and December 2025.
- Seer Interactive. AIO Impact on Google CTR: 2026 Update. 24 April 2026. Observation period: January 2025 to February 2026 actuals.
- Adobe. AI traffic now generates 83% higher revenue per visit for U.S. retailers heading into the holiday shopping season. 29 October 2026. Observation period: September 2026.
- Demandbase. ChatGPT Referrals to B2B Websites Nearly Quadrupled in a Year. 12 August 2026. Observation period: Referral endpoints June 2025 and June 2026; wider dataset June 2025–July 2026.
- Similarweb. State of Ecommerce 2026 Report Details How AI is Changing Shopper Journey. 10 September 2026. Observation period: 2026 report; precise overlap measurement window not stated in release.
- OpenAI. How people are using ChatGPT. 15 September 2025. Observation period: Consumer usage research through mid-2025.
- Google / Liz Reid. AI in Search is driving more queries and higher quality clicks. 6 August 2025. Observation period: Year-on-year statement at publication.
Marketix Digital combines search evidence, market research and commercial modelling to set investment priorities around measurable business outcomes.