Which Australian State is doing it the toughest with cost of living pressures?

Which Australian state is doing it the toughest with cost of living pressures? The search and ABS data doesn't lie!
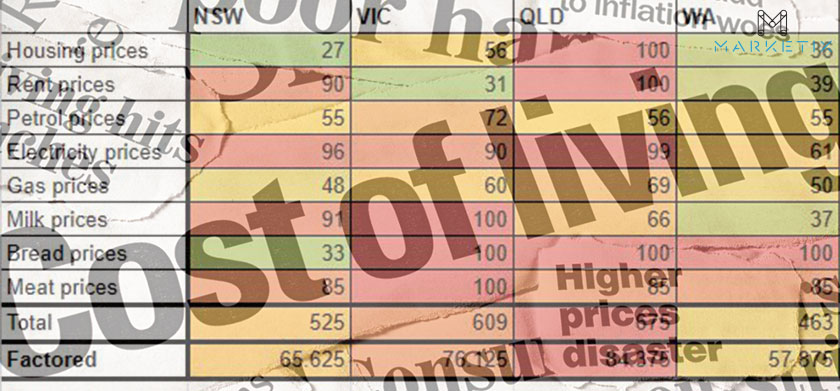
Shoaib Mughal, Managing Director of Australian search and analytics agency Marketix Digital stated “Among all the states in Australia it is Queensland with a factored rating of 84.38 that is having more concern and is looking at the prices of basic commodities more. Followed by Victoria in second with 76.13 and third is South Australia with 74.75. This data tells us that Australians are doing it tough at the moment and need as much support as possible!”
Here is the full ordered list of Factored Search results within 30 days up until today (May 6, 2024):
| 1. | Queensland | 84.38 |
| 2. | Victoria | 76.13 |
| 3. | South Australia | 74.75 |
| 4. | New South Wales | 65.63 |
| 5. | West Australia | 57.88 |
| 6. | Australian Capital Territory | 32.13 |
| 7. | Tasmania | 25 |
| 8. | Northern Territory | 18.5 |
Basic commodities that were factored in these were, housing costs, rental costs, petrol costs, electricity costs, gas prices, milk prices, bread, and meat costs.

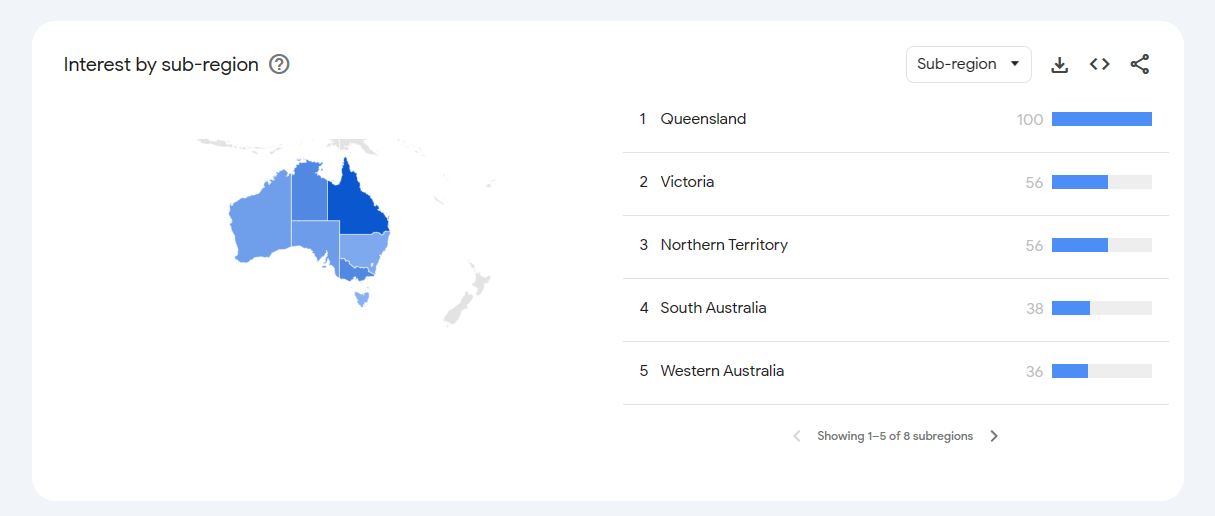
For housing costs, Queensland is on top with 100 feeling the most pressured by the movement of prices, Tied for second is Victoria, and the Northern Territory with 56.

Queensland also topped the searches for rental costs with an interest score of 100, followed by New South Wales at 90 and West Australia at 39.
Not the same can be said about Petrol prices, as South Australia is more concerned with the prices of petrol moving with an interest score of 100, followed in second by Victoria with 72 and not far behind is Queensland with 56.
For electricity prices, the Australian Capital Territory is feeling the pressure and wants to know how the prices go with an interest score of 100, not far behind is Queensland with 99, and tied at third are South Australia and New South Wales with 96.
Gas prices are most watched out for but South Australia is leading the interest score with 100, followed by Queensland at 69 and third Victoria.
Milk prices are also being watched, with Victoria leading the interest score at 100, followed by 91 for New South Wales and 66 for Queensland.
Bread costs are searched the most by 4 states, with an interest score of 100 from Queensland, Victoria, West Australia, and South Australia.
Meat Prices have been searched the most by Victoria with an interest score of 100 but are tied from across 4 states after that, all with an interest score of 85 are Queensland, New South Wales, West Australia, and South Australia.
Shoaib, Managing Director of Marketix Digital, also highlighted, “The data tells us that Queensland is feeling the pressure and is most sensitive to the pricing across all major basic commodities.”
Coming from the ABS CPI index report as of March 2024 Consumer Price Index, Australia, March Quarter 2024 | Australian Bureau of Statistics (abs.gov.au), Housing and rental CPI is up by 2.1% and total CPI for Australia is up by 1%. ABS also shows that in all capital cities, CPI has risen ranging from 0.6% up to 1.1%. Brisbane the capital city of Queensland has a CPI increase of 1.1% in the March 2024 data by ABS.
This backs up why interest scores especially for major basic commodities such as housing and rental are high and are a point of concern.
Here are the full rankings of search interest scores per commodity:
Housing Rates:
| 1. | Queensland | 100 |
| 2. | Victoria | 56 |
| 3. | Northern Territory | 56 |
| 4. | South Australia | 38 |
| 5. | West Australia | 36 |
| 6. | Australian Capital Territory | 28 |
| 7. | New South Wales | 27 |
| 8. | asmania | 20 |
Rent Prices:
| 1. | Queensland | 100 |
| 2. | New South Wales | 90 |
| 3. | West Australia | 39 |
| 4. | South Australia | 35 |
| 5. | Victoria | 31 |
| 6. | Australian Capital Territory | 17 |
Petrol Prices:
| 1. | South Australia | 100 |
| 2. | Victoria | 72 |
| 3. | Queensland | 56 |
| 4. | New South Wales | 55 |
| 5. | West Australia | 55 |
| 6. | Australian Capital Territory | 27 |
| 7. | Northern Territory | 18 |
| 8. | Tasmania | 17 |
Electricity Prices:
| 1. | Australian Capital Territory | 100 |
| 2. | Queensland | 99 |
| 3. | New South Wales | 96 |
| 4. | South Australia | 96 |
| 5. | Victoria | 90 |
| 6. | Tasmania | 67 |
| 7. | West Australia | 61 |
| 8. | Northern Territory | 28 |
Gas Prices:
| 1. | South Australia | 100 |
| 2. | Queensland | 9 |
| 3. | ictoria | 60 |
| 4. | Tasmania | 59 |
| 5. | Australian Capital Territory | 50 |
| 6. | West Australia | 50 |
| 7. | New South Wales | 48 |
| 8. | Northern Territory | 46 |
Milk Prices:
| 1. | Victoria | 100 |
| 2. | New South Wales | 91 |
| 3. | Queensland | 66 |
| 4. | South Australia | 44 |
| 5. | West Australia | 37 |
| 6. | Tasmania | 37 |
| 7. | Australian Capital Territory | 35 |
Bread Prices:
| 1. | Queensland | 100 |
| 2. | Victoria | 100 |
| 3. | West Australia | 100 |
| 4. | South Australia | 100 |
| 5. | New South Wales | 33 |
Meat Prices:
| 1. | Victoria | 100 |
| 2. | Queensland | 85 |
| 3. | New South Wales | 85 |
| 4. | West Australia | 85 |
| 5. | South Australia | 85 |
The overall search data surrounding the cost of living data in Australia serves as a powerful example of how businesses and marketers can leverage search trends to drive growth.
By analysing search data and identifying spikes in interest, businesses can gain valuable insights into consumer behaviour, preferences, and emerging trends.
Using this data effectively can help businesses make informed decisions regarding product launches, marketing campaigns, and overall business strategies. For example, by monitoring search queries related to their industry, businesses can identify rising trends and tailor their offerings to meet consumer demands.

Free Download SEO Book
Download our 24-page SEO book to learn:
- How SEO Really Works
- How to Rank #1
- Content & SEO
- Choosing an SEO Agency
Thank you!
You have successfully joined our subscriber list.


